Chart
Contents
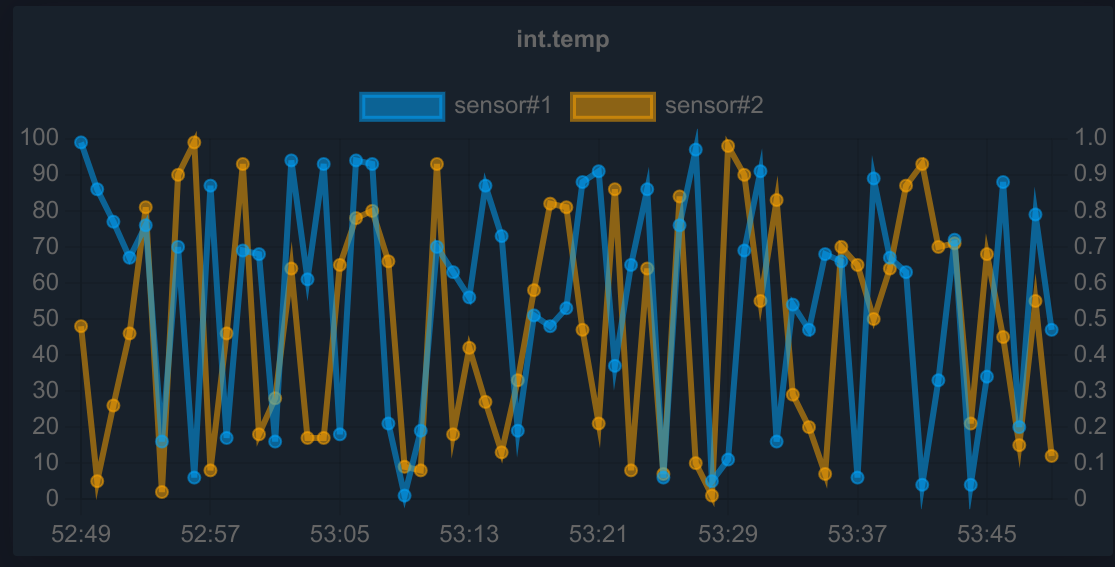
React component. Displays a chart (based on Chart.js v4)
Example
import {
  Chart as ChartJS,
  CategoryScale,
  LinearScale,
  PointElement,
  LineElement,
  TimeScale,
  Title,
  Tooltip,
  Legend
} from "chart.js";
import "chartjs-adapter-date-fns";
import { Chart, ChartKind } from "@eva-ics/webengine-react";

ChartJS.register(
  CategoryScale,
  LinearScale,
  PointElement,
  LineElement,
  TimeScale,
  Title,
  Tooltip,
  Legend
);

const MyBlock = () => {
  const chart_oids = ["sensor:tests/temp", "sensor:tests/temp2"];
  return (
    <>
      <Chart
        oid={chart_oids}
        kind={ChartKind.Line}
        timeframe="1T"
        fill="1S:2"
        title="int.temp"
        update={2}
        colors={["rgba(0,165,255, 0.5)", "rgba(255,165,0, 0.5)"]}
        labels={["sensor#1", "sensor#2"]}
        options={{
          responsive: true,
          animations: false
        }}
      />
      ;
    </>
  );
};
Preparing
Additional modules required:
npm install --save "chart.js"
npm install --save "chartjs-adapter-date-fns"
Parameters
See useEvaStateHistory hook.
name |
type |
required |
description |
|---|---|---|---|
kind |
ChartKind |
no |
Chart kind (Line, Bar, Radar, Doughnut) |
colors |
Array<string> |
no |
line colors |
labels |
Array<string> |
no |
line labels |
formula |
string/Array<string> |
no |
value modification formula(s) e.g. “x/1000” |
title |
string |
no |
chart title |
options |
any |
no |
custom Chart.js options |
engine |
Eva |
no |
WebEngine object (if no default set) |
CSS classes
name |
description |
|---|---|
div.eva.chart.container |
primary chart container |
div.eva.chart.error |
chart error messages |
div.eva.chart.loading |
chart loading progress messages |