Elastic (ELK)
EVA ICS logs can be viewed/processed with Elastic.
EVA ICS can output JSON logs to syslog, but ELK syslog agent can not parse JSON syslog messages. This document explains how to setup ELK to parse EVA ICS file logs.
Prepare EVA ICS
For all configured node components (config/<controller>/main registry keys).
log_format: { "loggerName":"%(name)s", "@timestamp":"%(asctime)s", "pathName":"%(pathname)s", "logRecordCreationTime":"%(created)f", "functionName":"%(funcName)s", "levelNo":"%(levelno)s", "lineNo":"%(lineno)d", "time":"%(msecs)d", "levelName":"%(levelname)s", "message":"%(message)s" }
make sure “log_file” options are also set, and restart EVA ICS services
eva server restart
Configure ELK
Install ELK stack on some machine
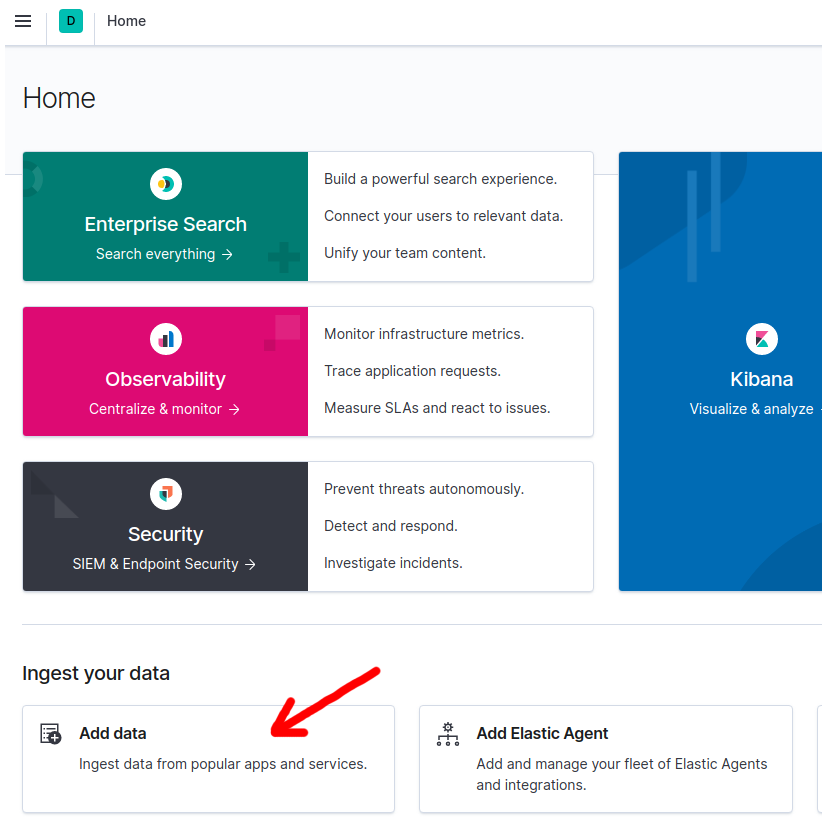
On the main Elastic dashboard, press “add data”
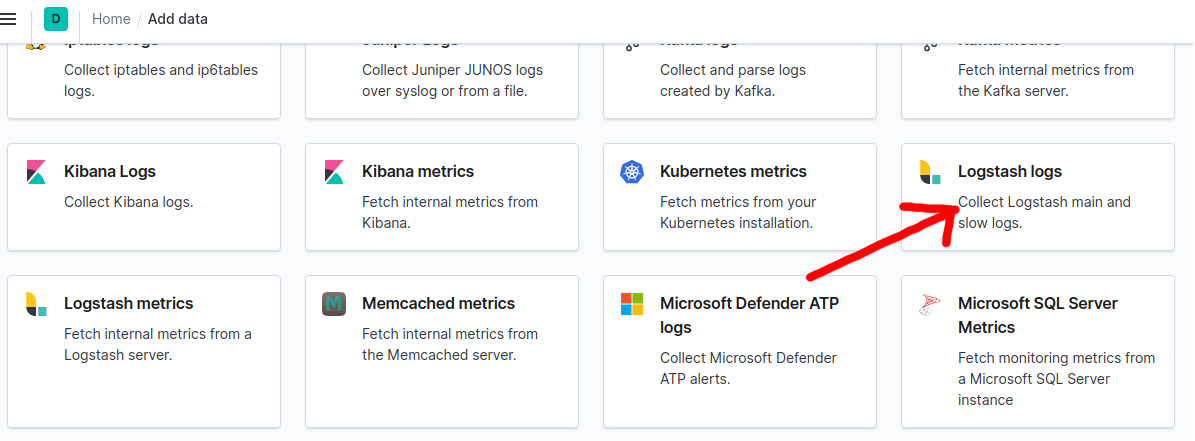
Select “Logstash logs”
Follow the given instructions and setup filebeat on all EVA ICS nodes.
Add the following section into “/etc/filebeat/filebeat.yml” on each EVA ICS node:
- type: log
  enabled: true
  paths:
    - /opt/eva/log/*.log
  json.keys_under_root: true
  json.message_key: "message"
  json.overwrite_keys: true
Configure “output.elasticsearch” section to let filebeat sink logs into the ElasticSearch instance.
Restart filebeat:
systemctl restart filebeat
EVA ICS log messages should immediately appear in ElasticSearch/Kibana.