Operation centre
Contents
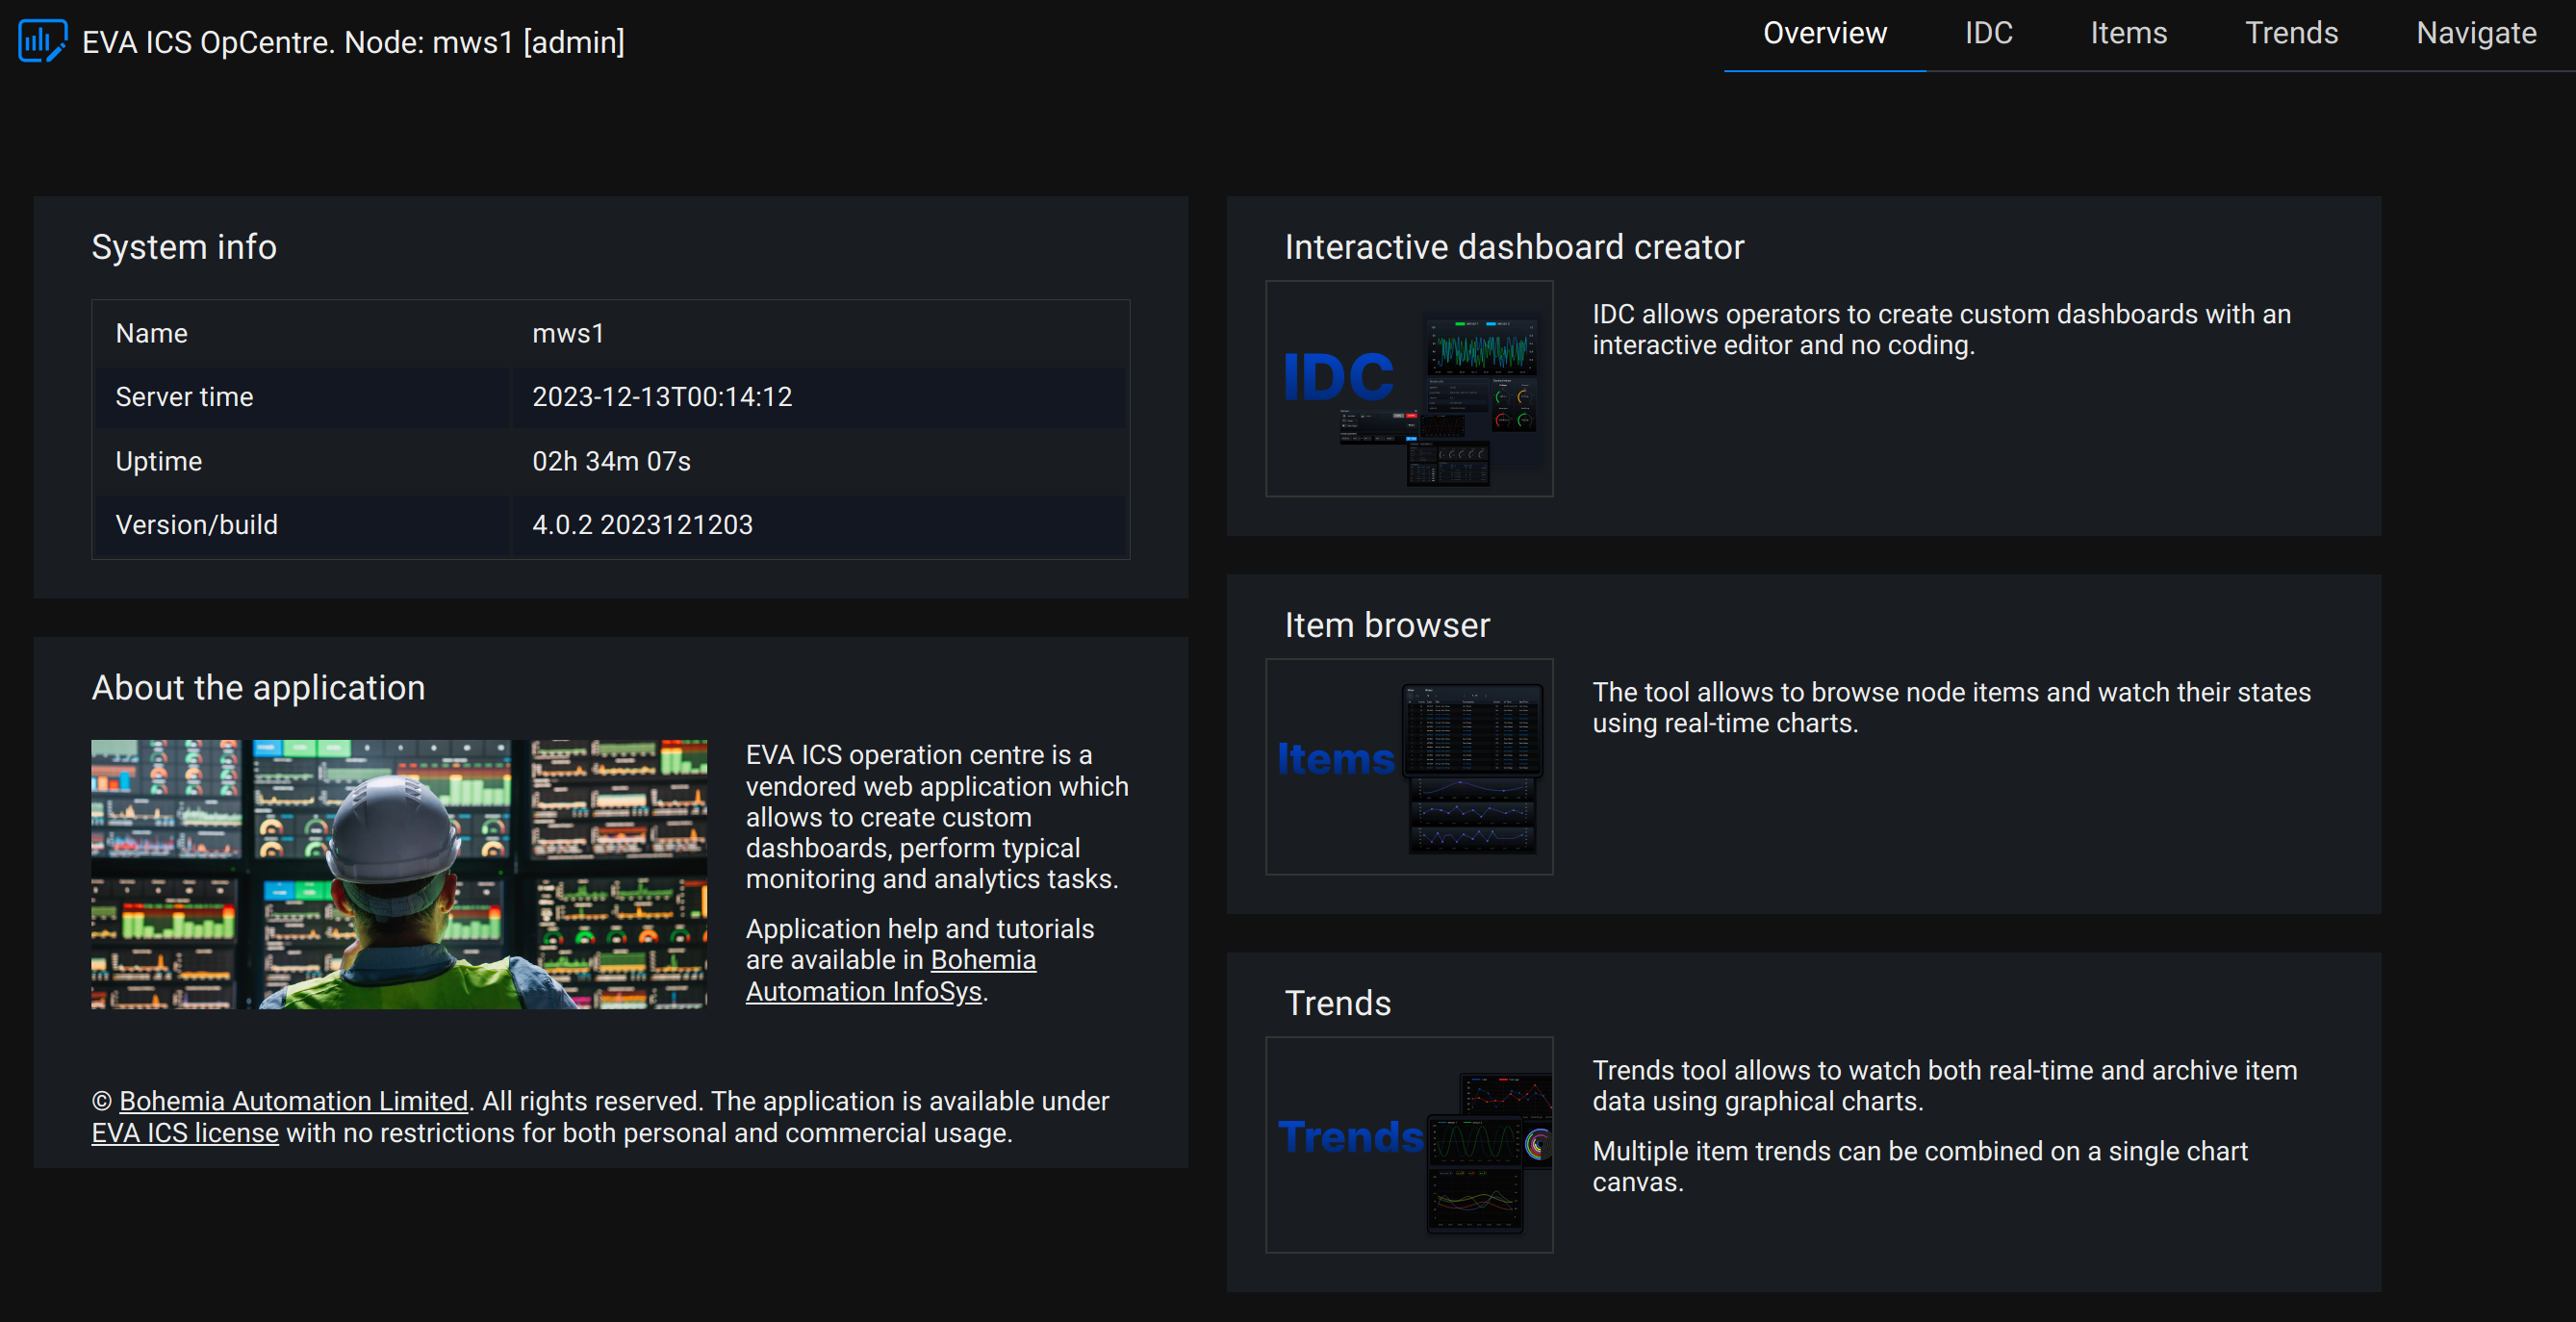
The vendored UI application allows operators to create custom dashboards, perform typical monitoring and analytics tasks.
Short URL:
http://HOST:PORT/va/opcentre/
Quick tour
Access levels
No special access level required to use the application. However, special permissions in Access control list required for users to read/create dashboard with IDC:
# to read custom dashboards from the server
read:
# ...
 pvt:
   - vendored-apps/opcentre/idc/dashboards/#
# to write custom dashboards to the server
write:
# ...
 pvt:
   - vendored-apps/opcentre/idc/dashboards/#
To access data objects, the user must have either admin access or “developer” ops allowed:
# ...
ops: ["developer"]
# ...
User access can be also limited to read/write specific dashboards only.
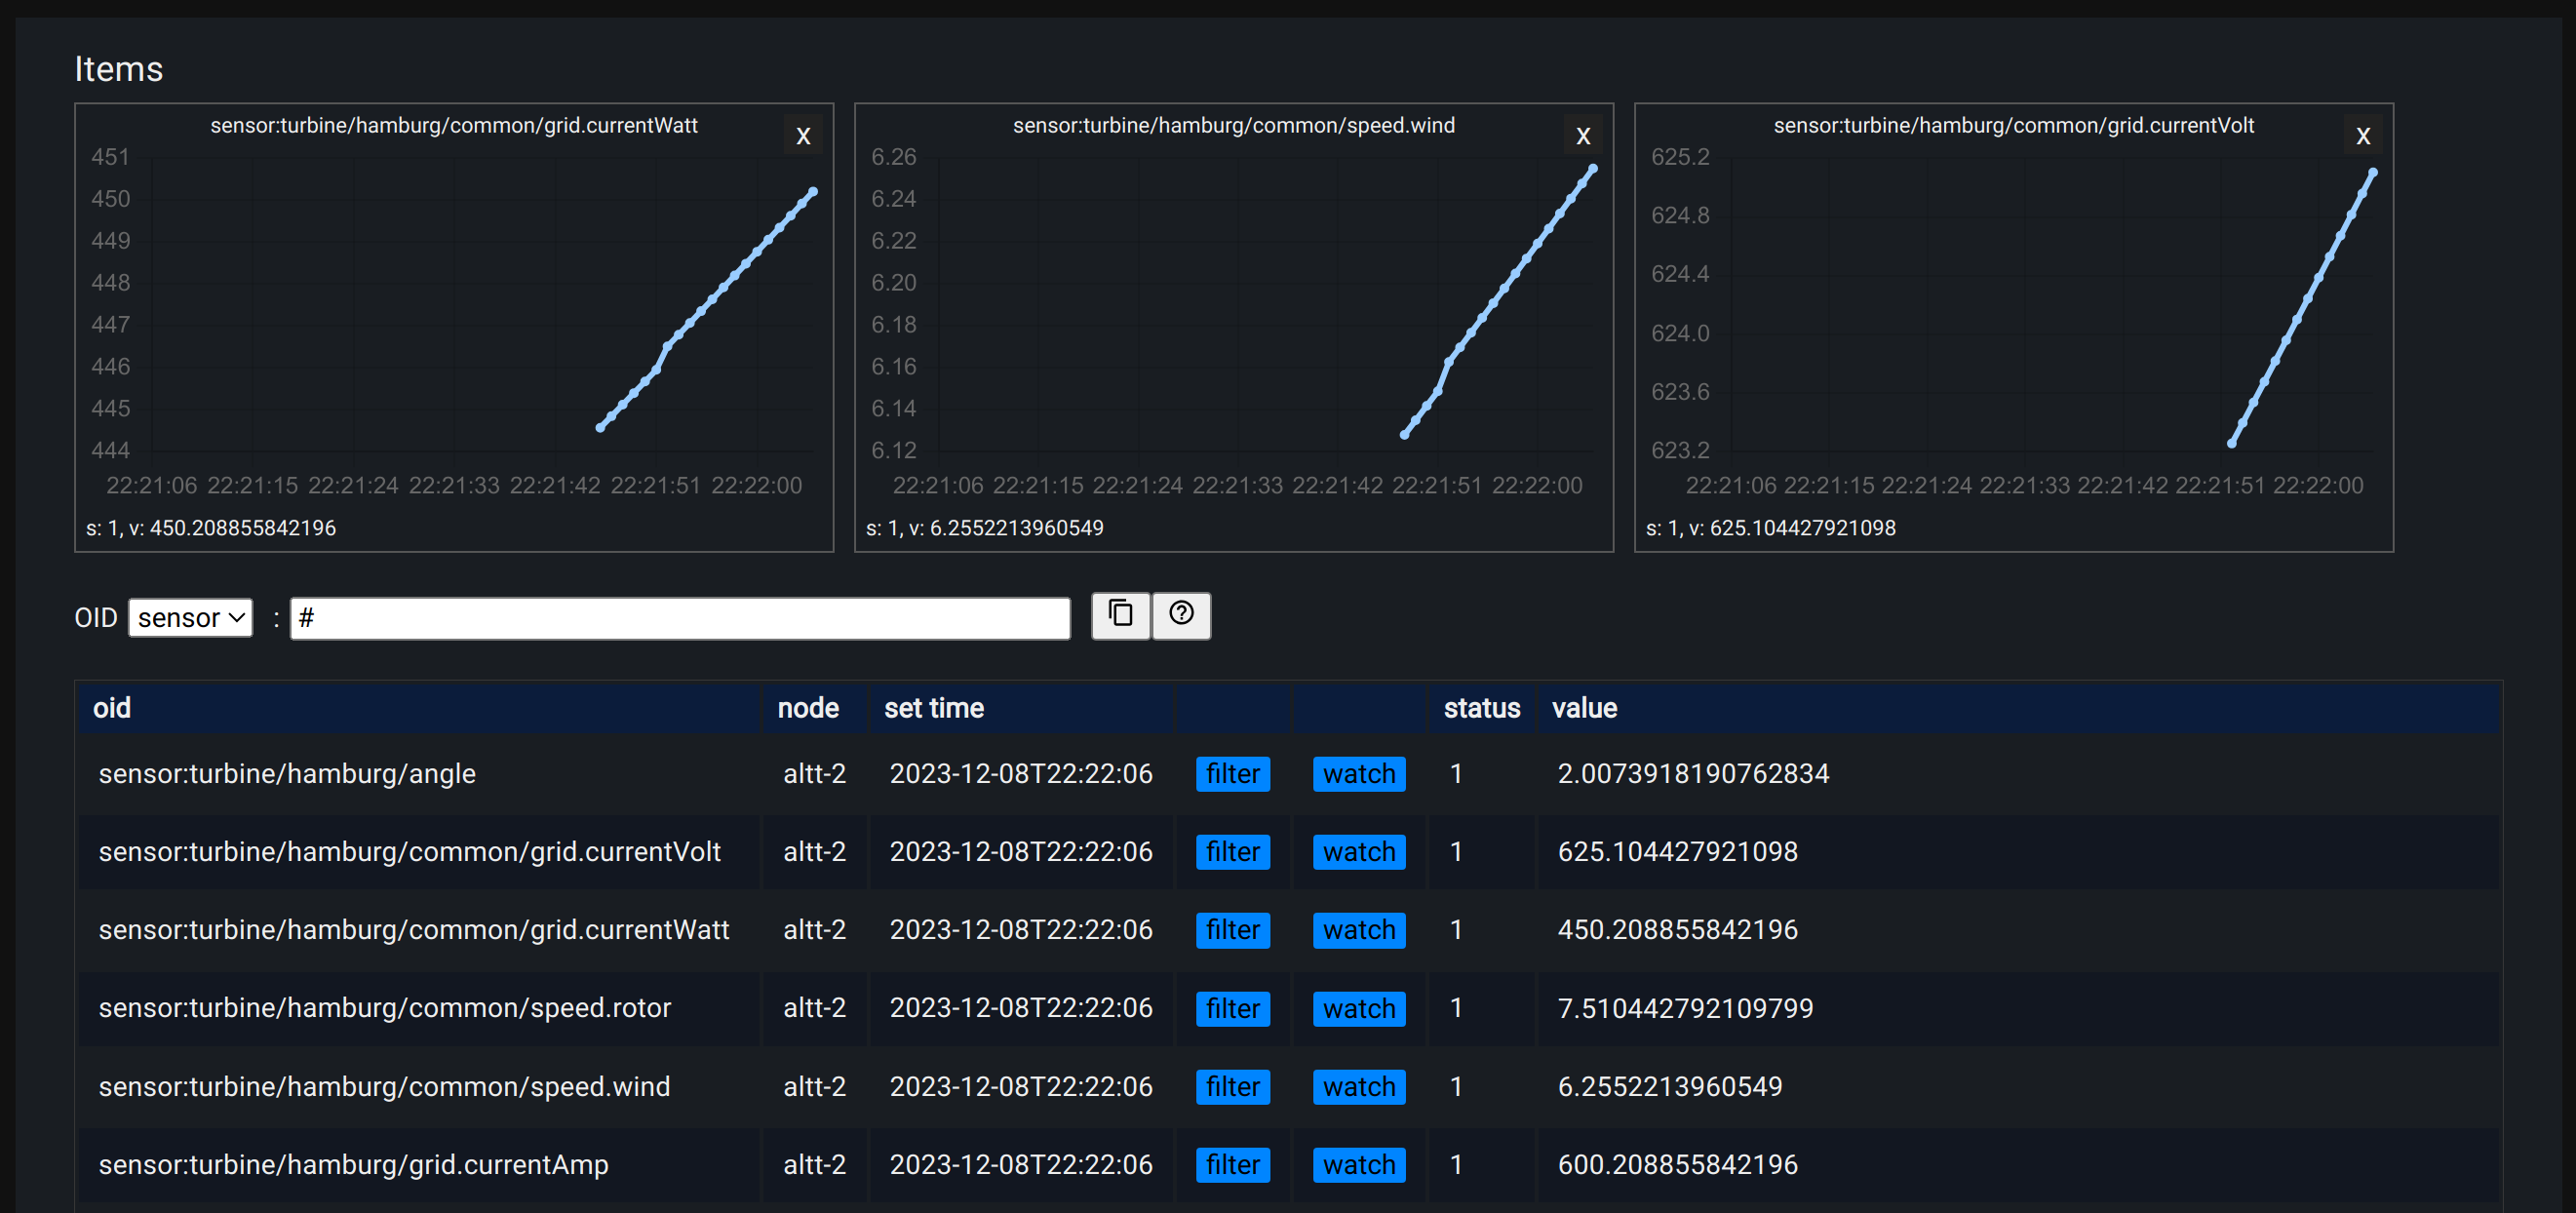
Items
The Items page allows to browse the node items. Use OID filter for item selection.
Alarms
The Alarms section allows to view current alarm states and alarm history.
Requires Alarm service service deployed.
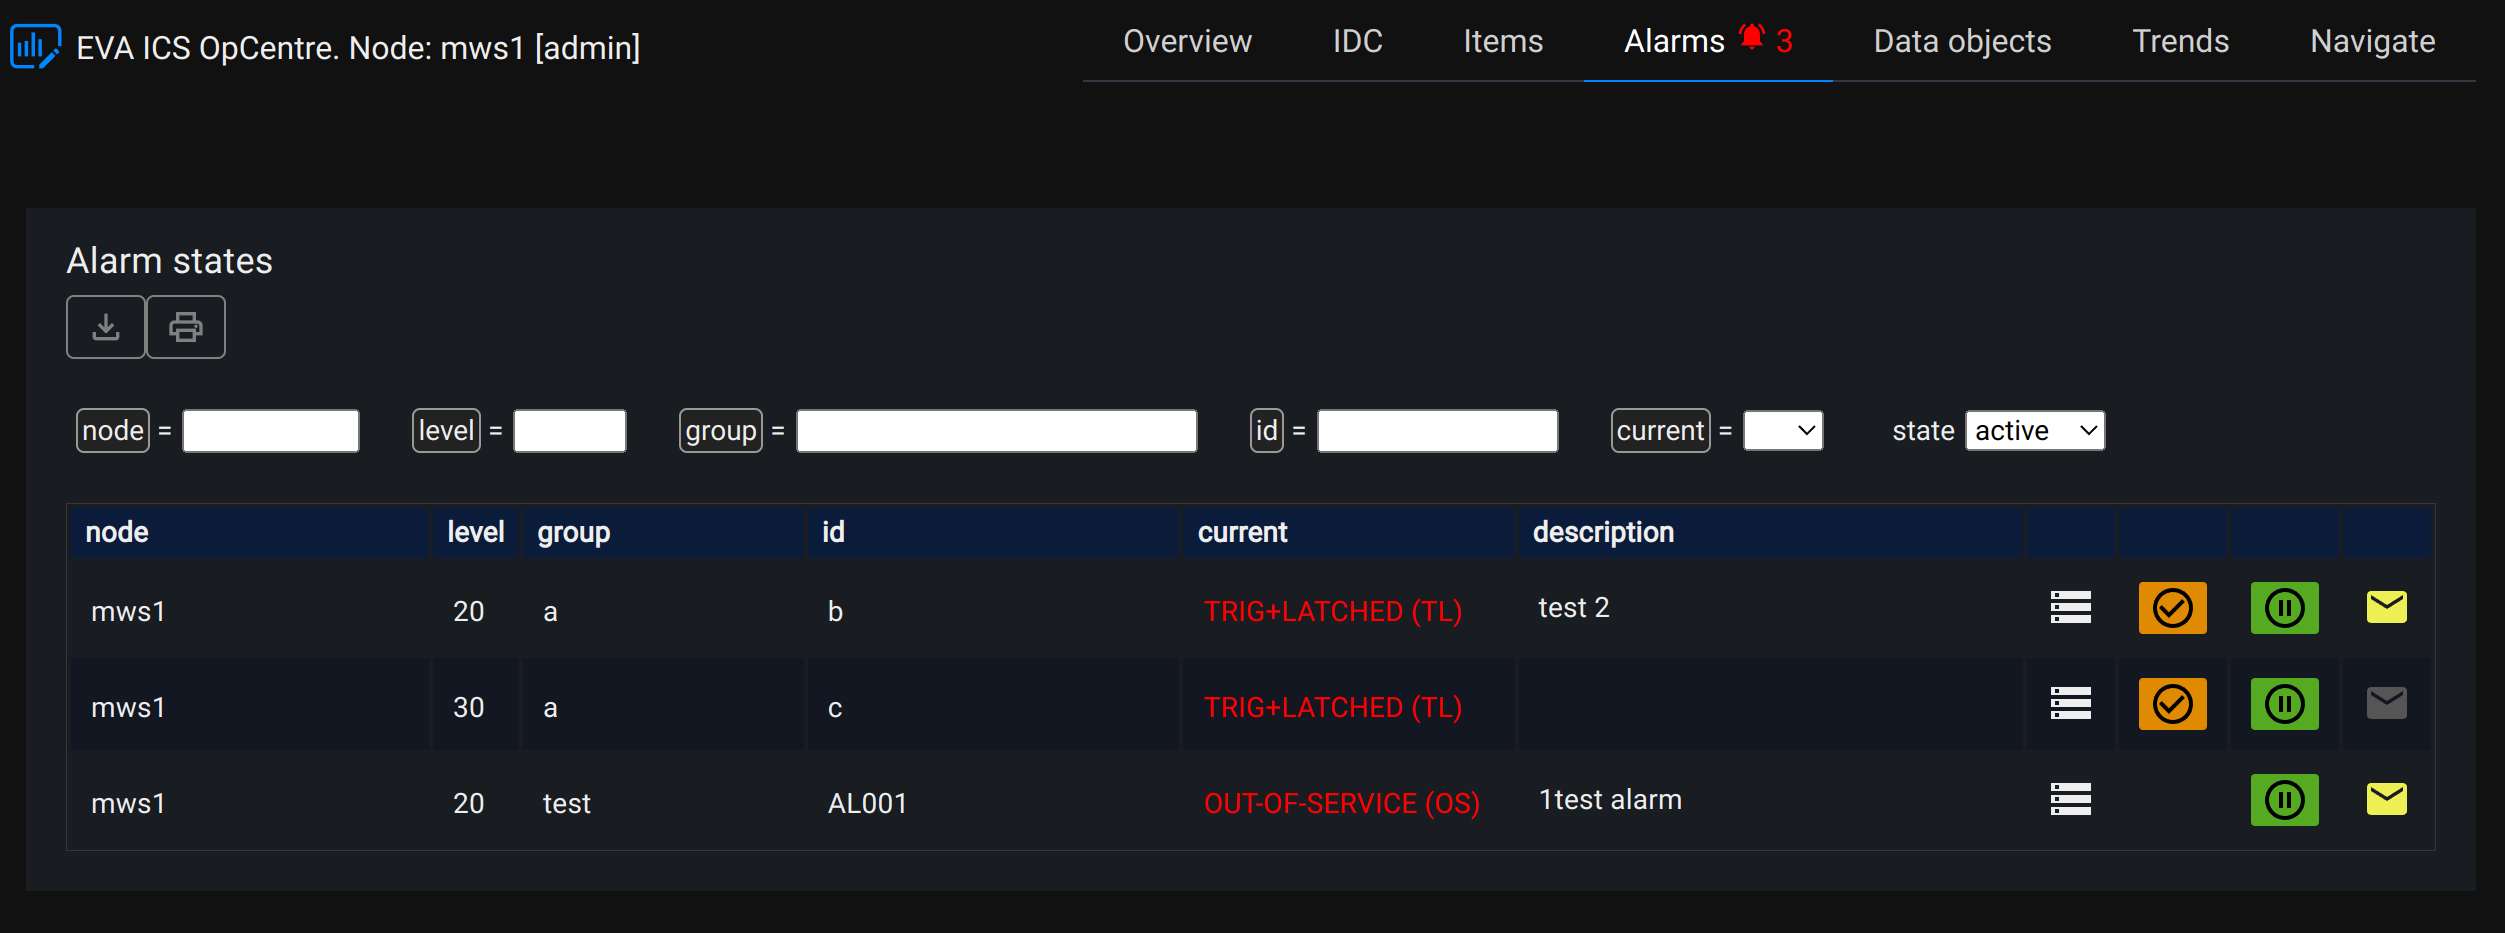
Alarm states
Alarm states page allows to view current alarm states, acknowledge, shelve/unshelve (suspend/resume) and manage alarm subscriptions.
The history button allows to switch to the alarm history page, filtered by the selected alarm.
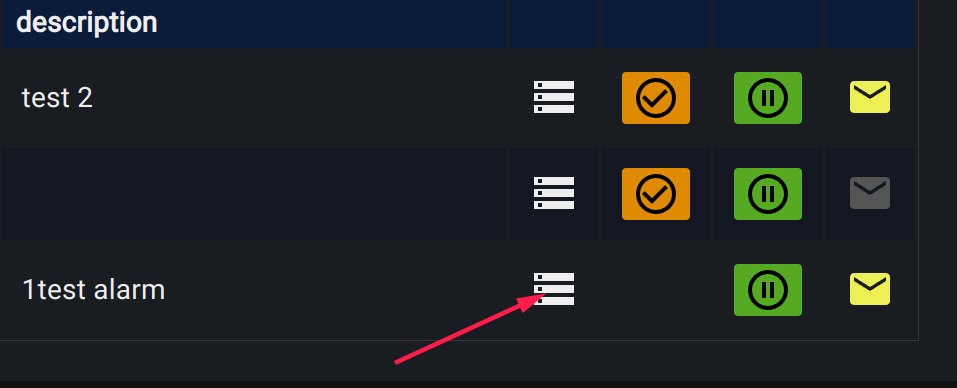
The acknowledge button allows to acknowledge a selected alarm.
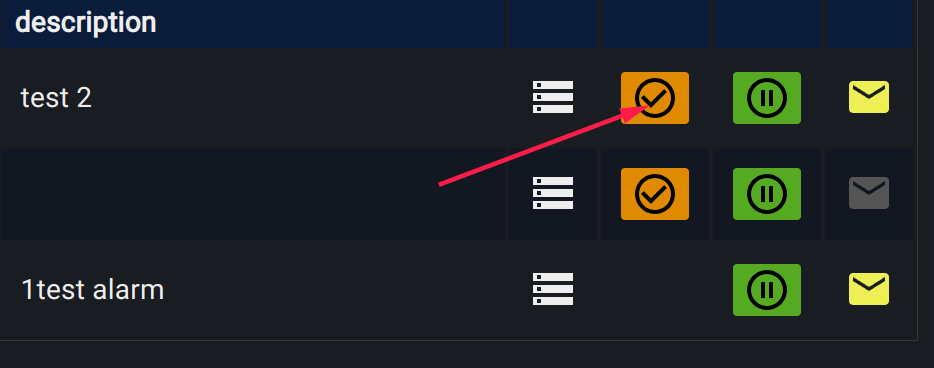
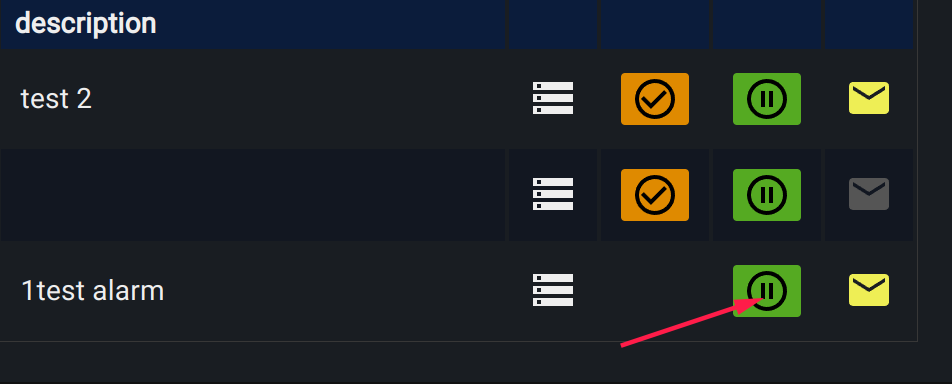
The shelve button allows to shelve (suspend) or unshelve (resume) a selected alarm.
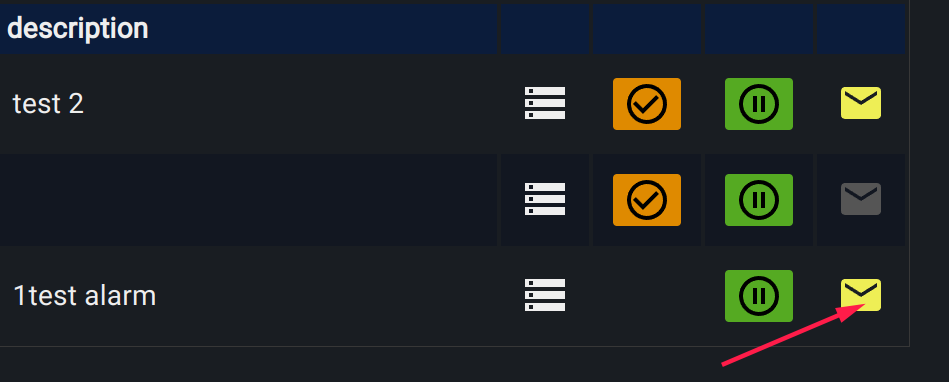
The subscribe button allows to subscribe/unsubscribe to a selected alarm. The following alarm events are subscribed:
TT - Triggered
TL - Triggered+Latched
OS - Out-of-service
Note
To receive alarm notifications, the user must have his email address set in the profile (Navigate -> Profile) or the email address must be provided by a 3rd party authentication service (e.g. Active directory auth service).
Alarm history
The alarm history page allows to view the alarm history, filtered by selected parameters.

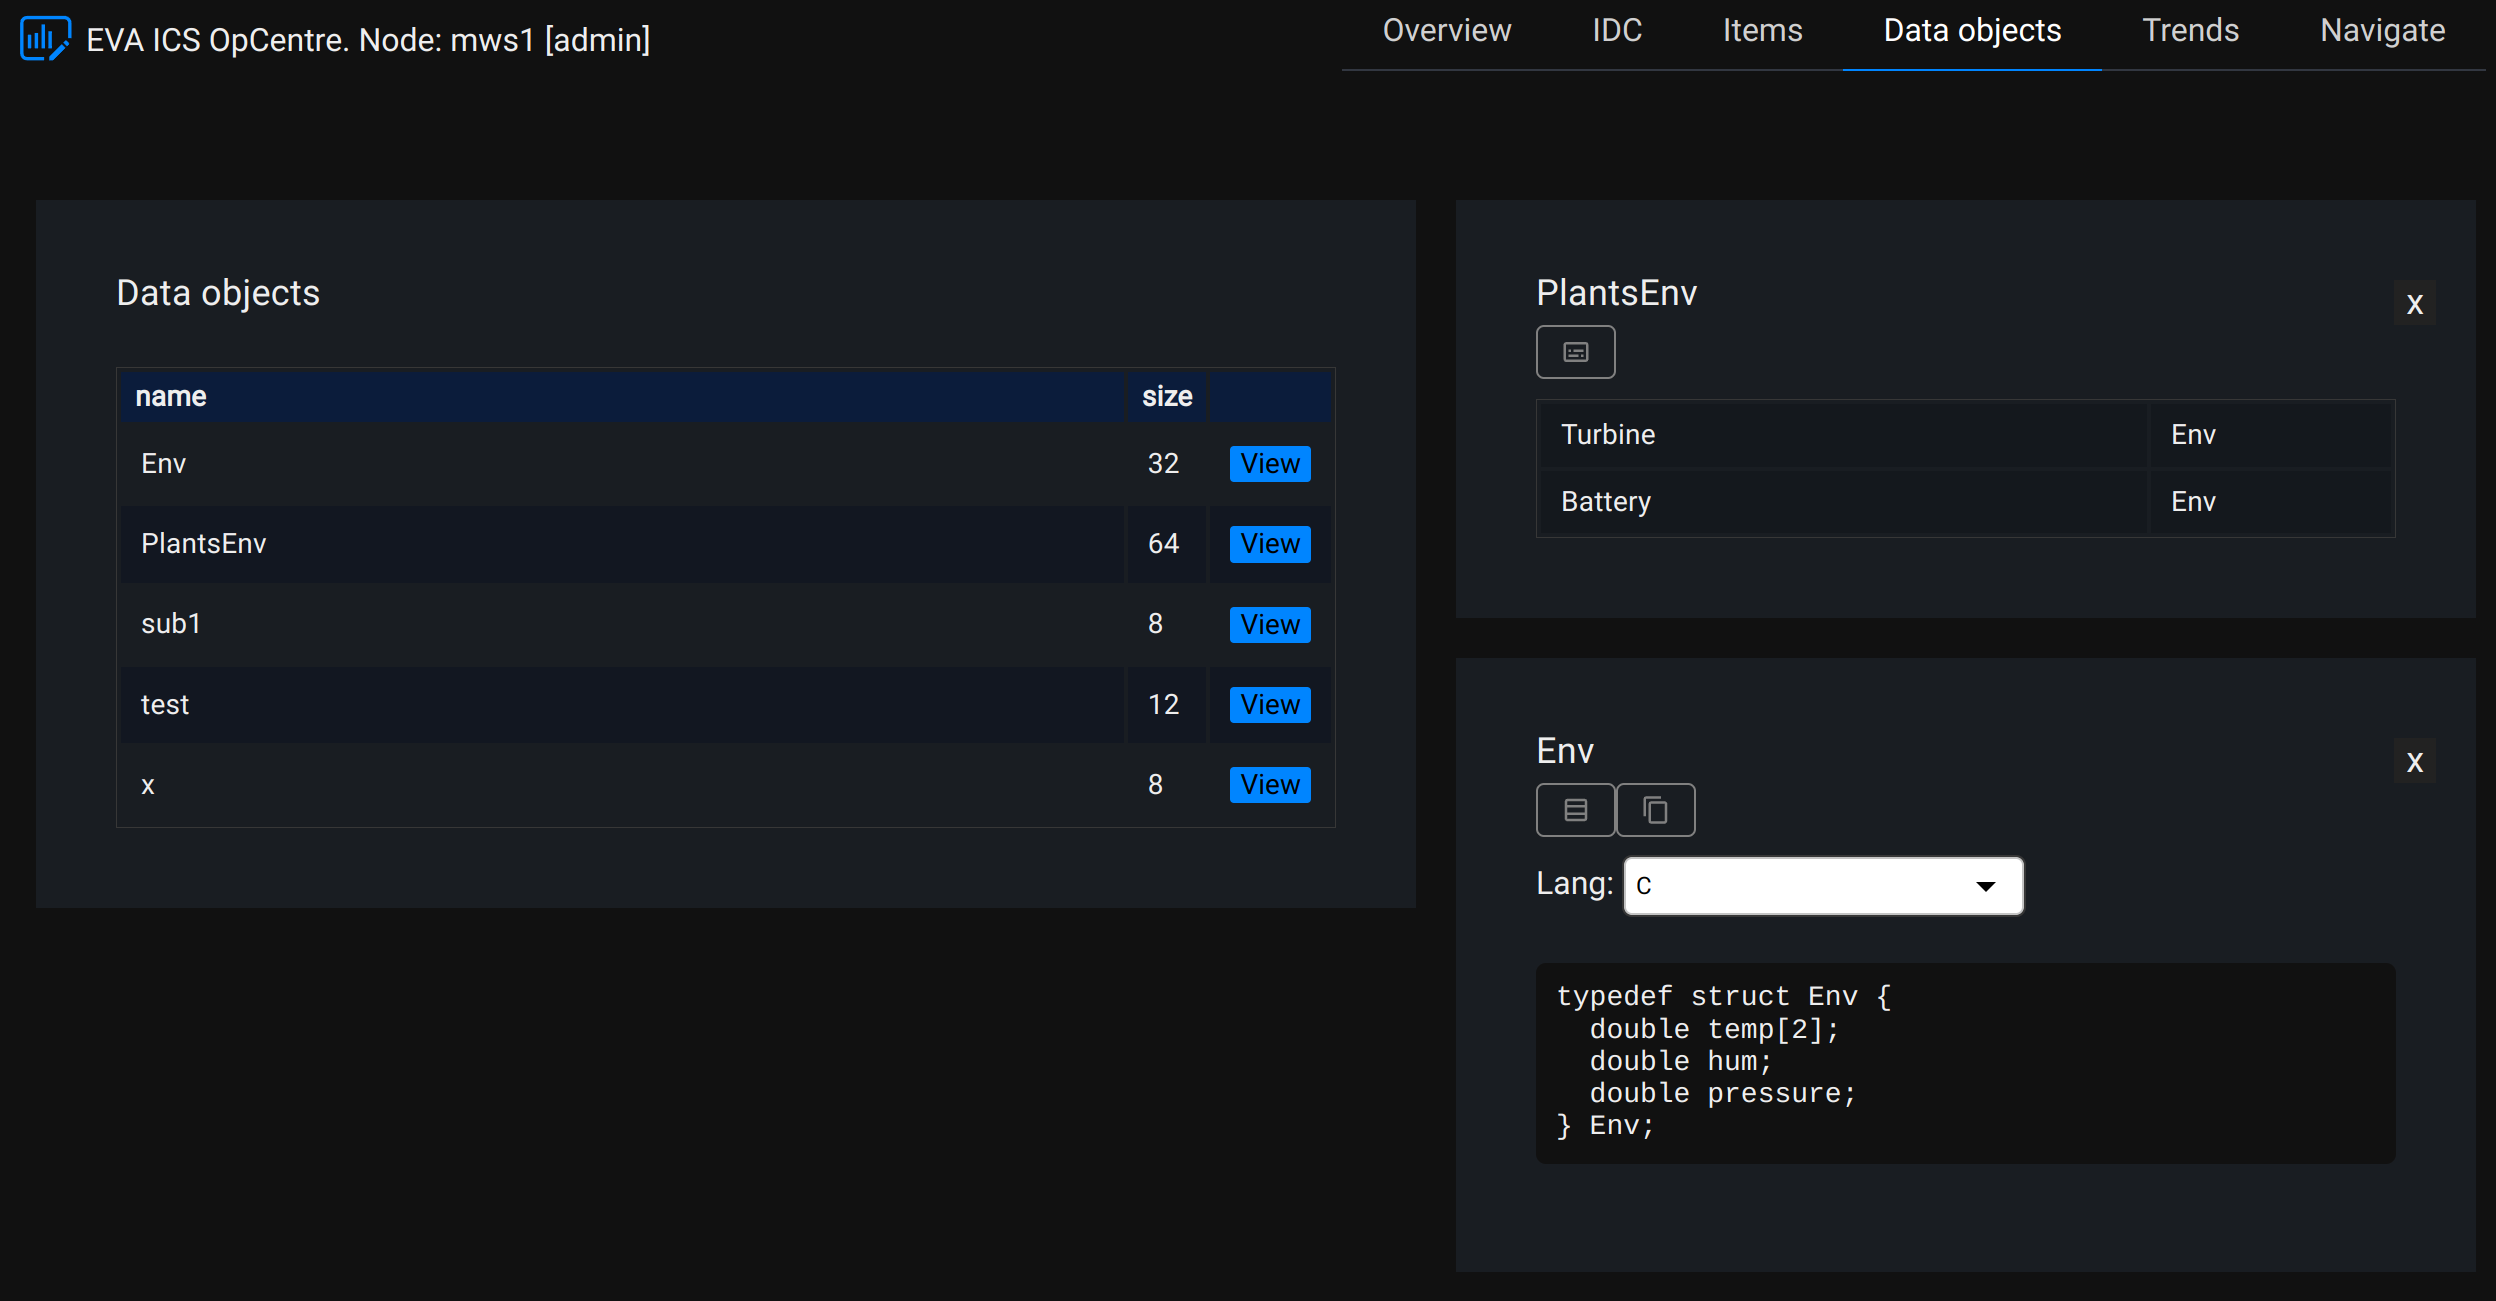
Data objects
The Data objects page allows to browse the node data objects, generate interface control documentation (ICD) and source code for programming languages.
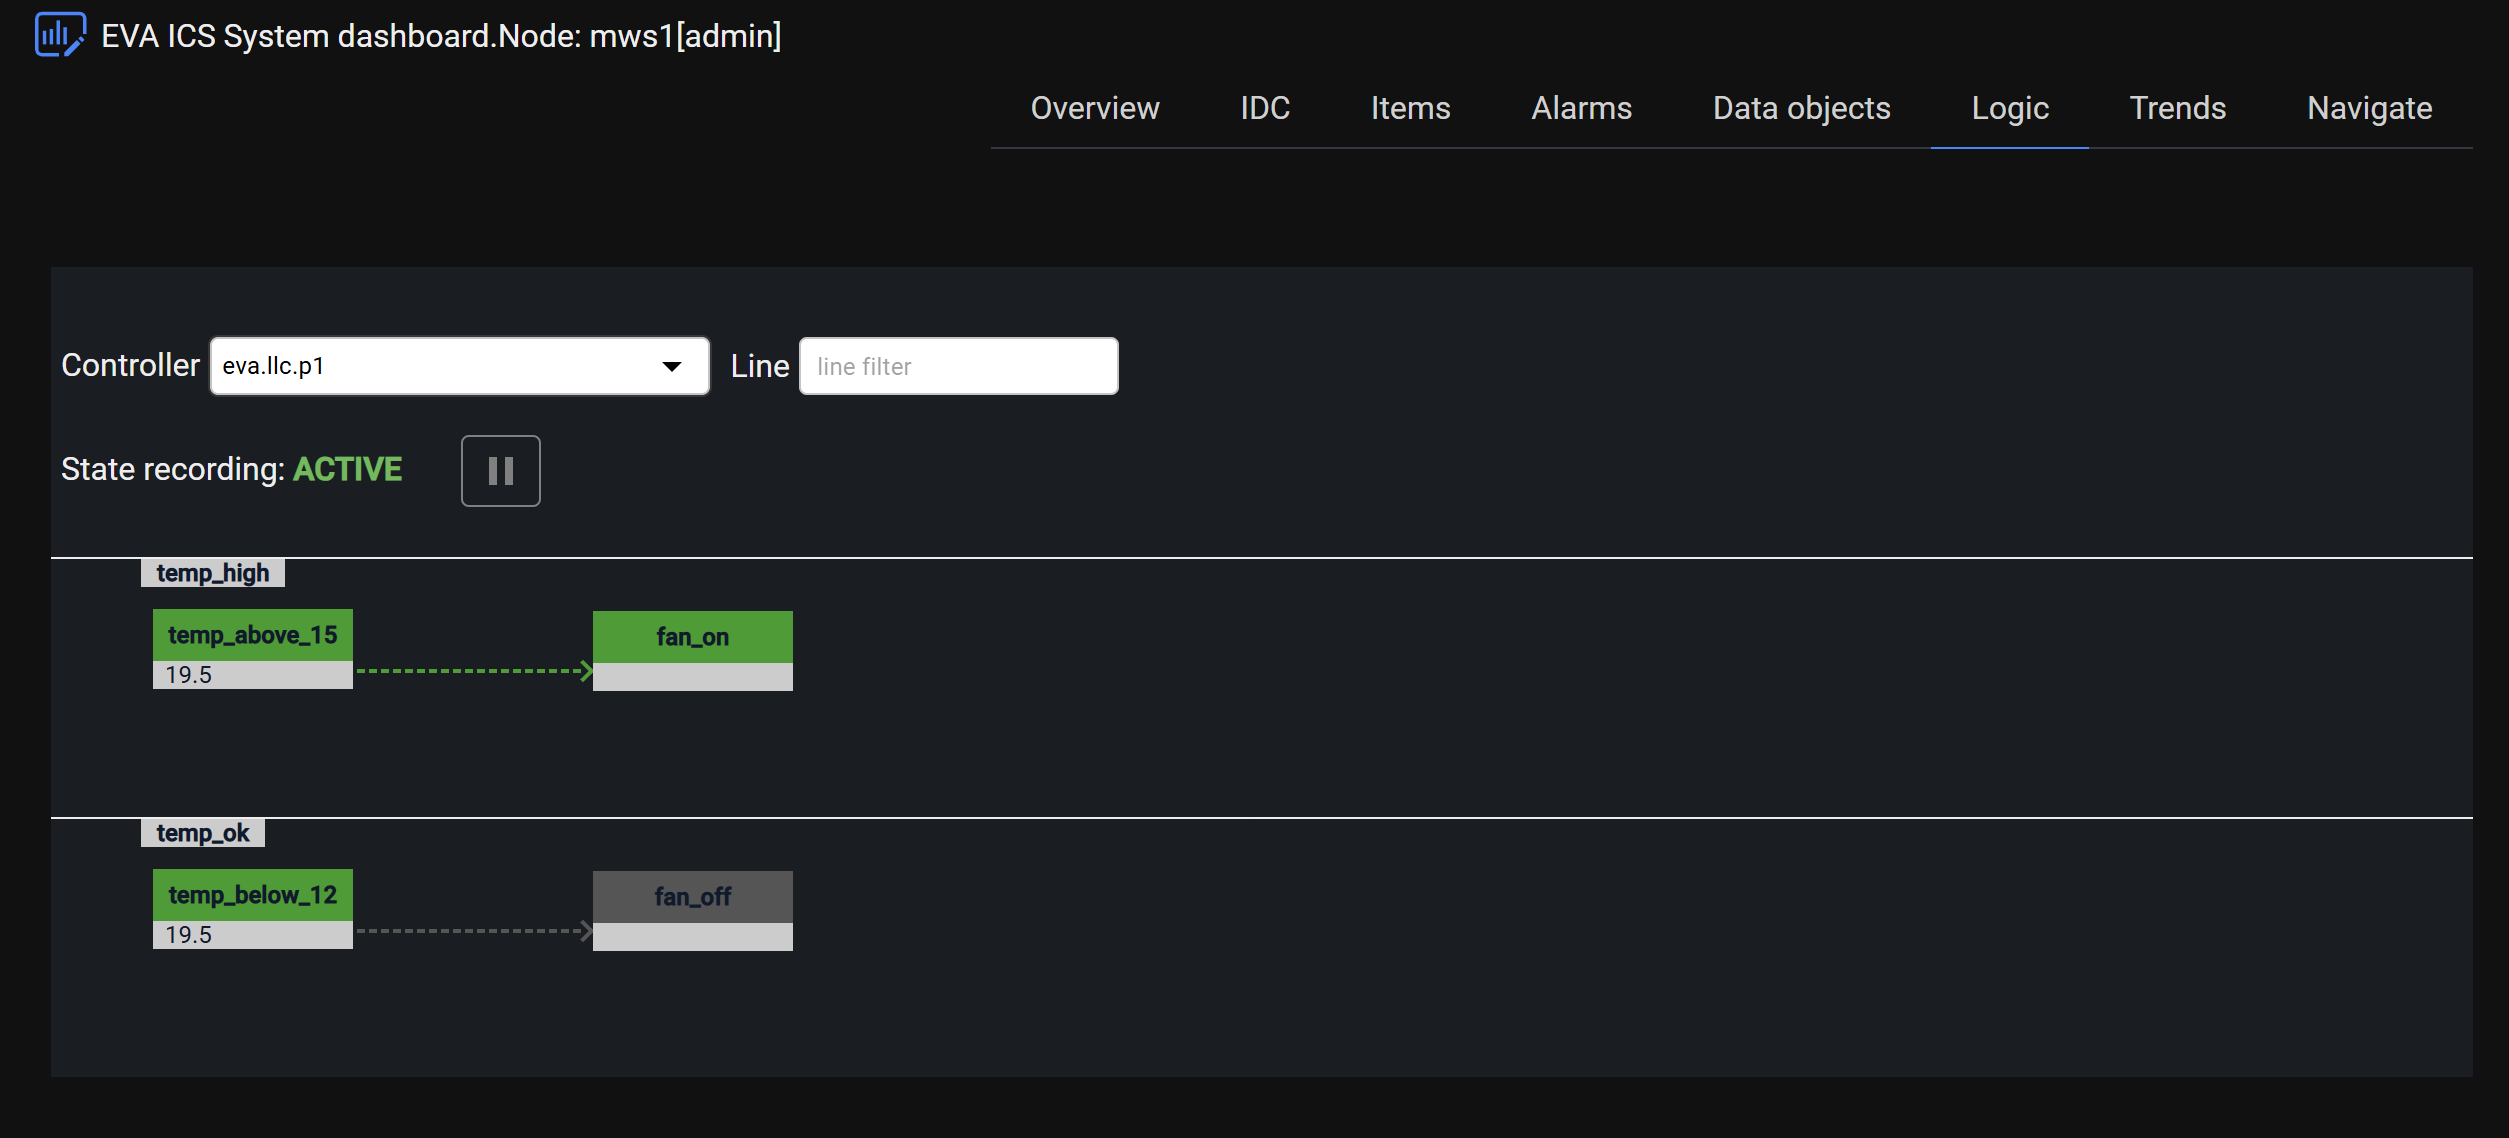
Logic
The Logic page displays visualization for Logic line controllers.
Trends
The Trends page allows to watch real-time and historical data as charts, putting a single or multiple values on the same canvas.
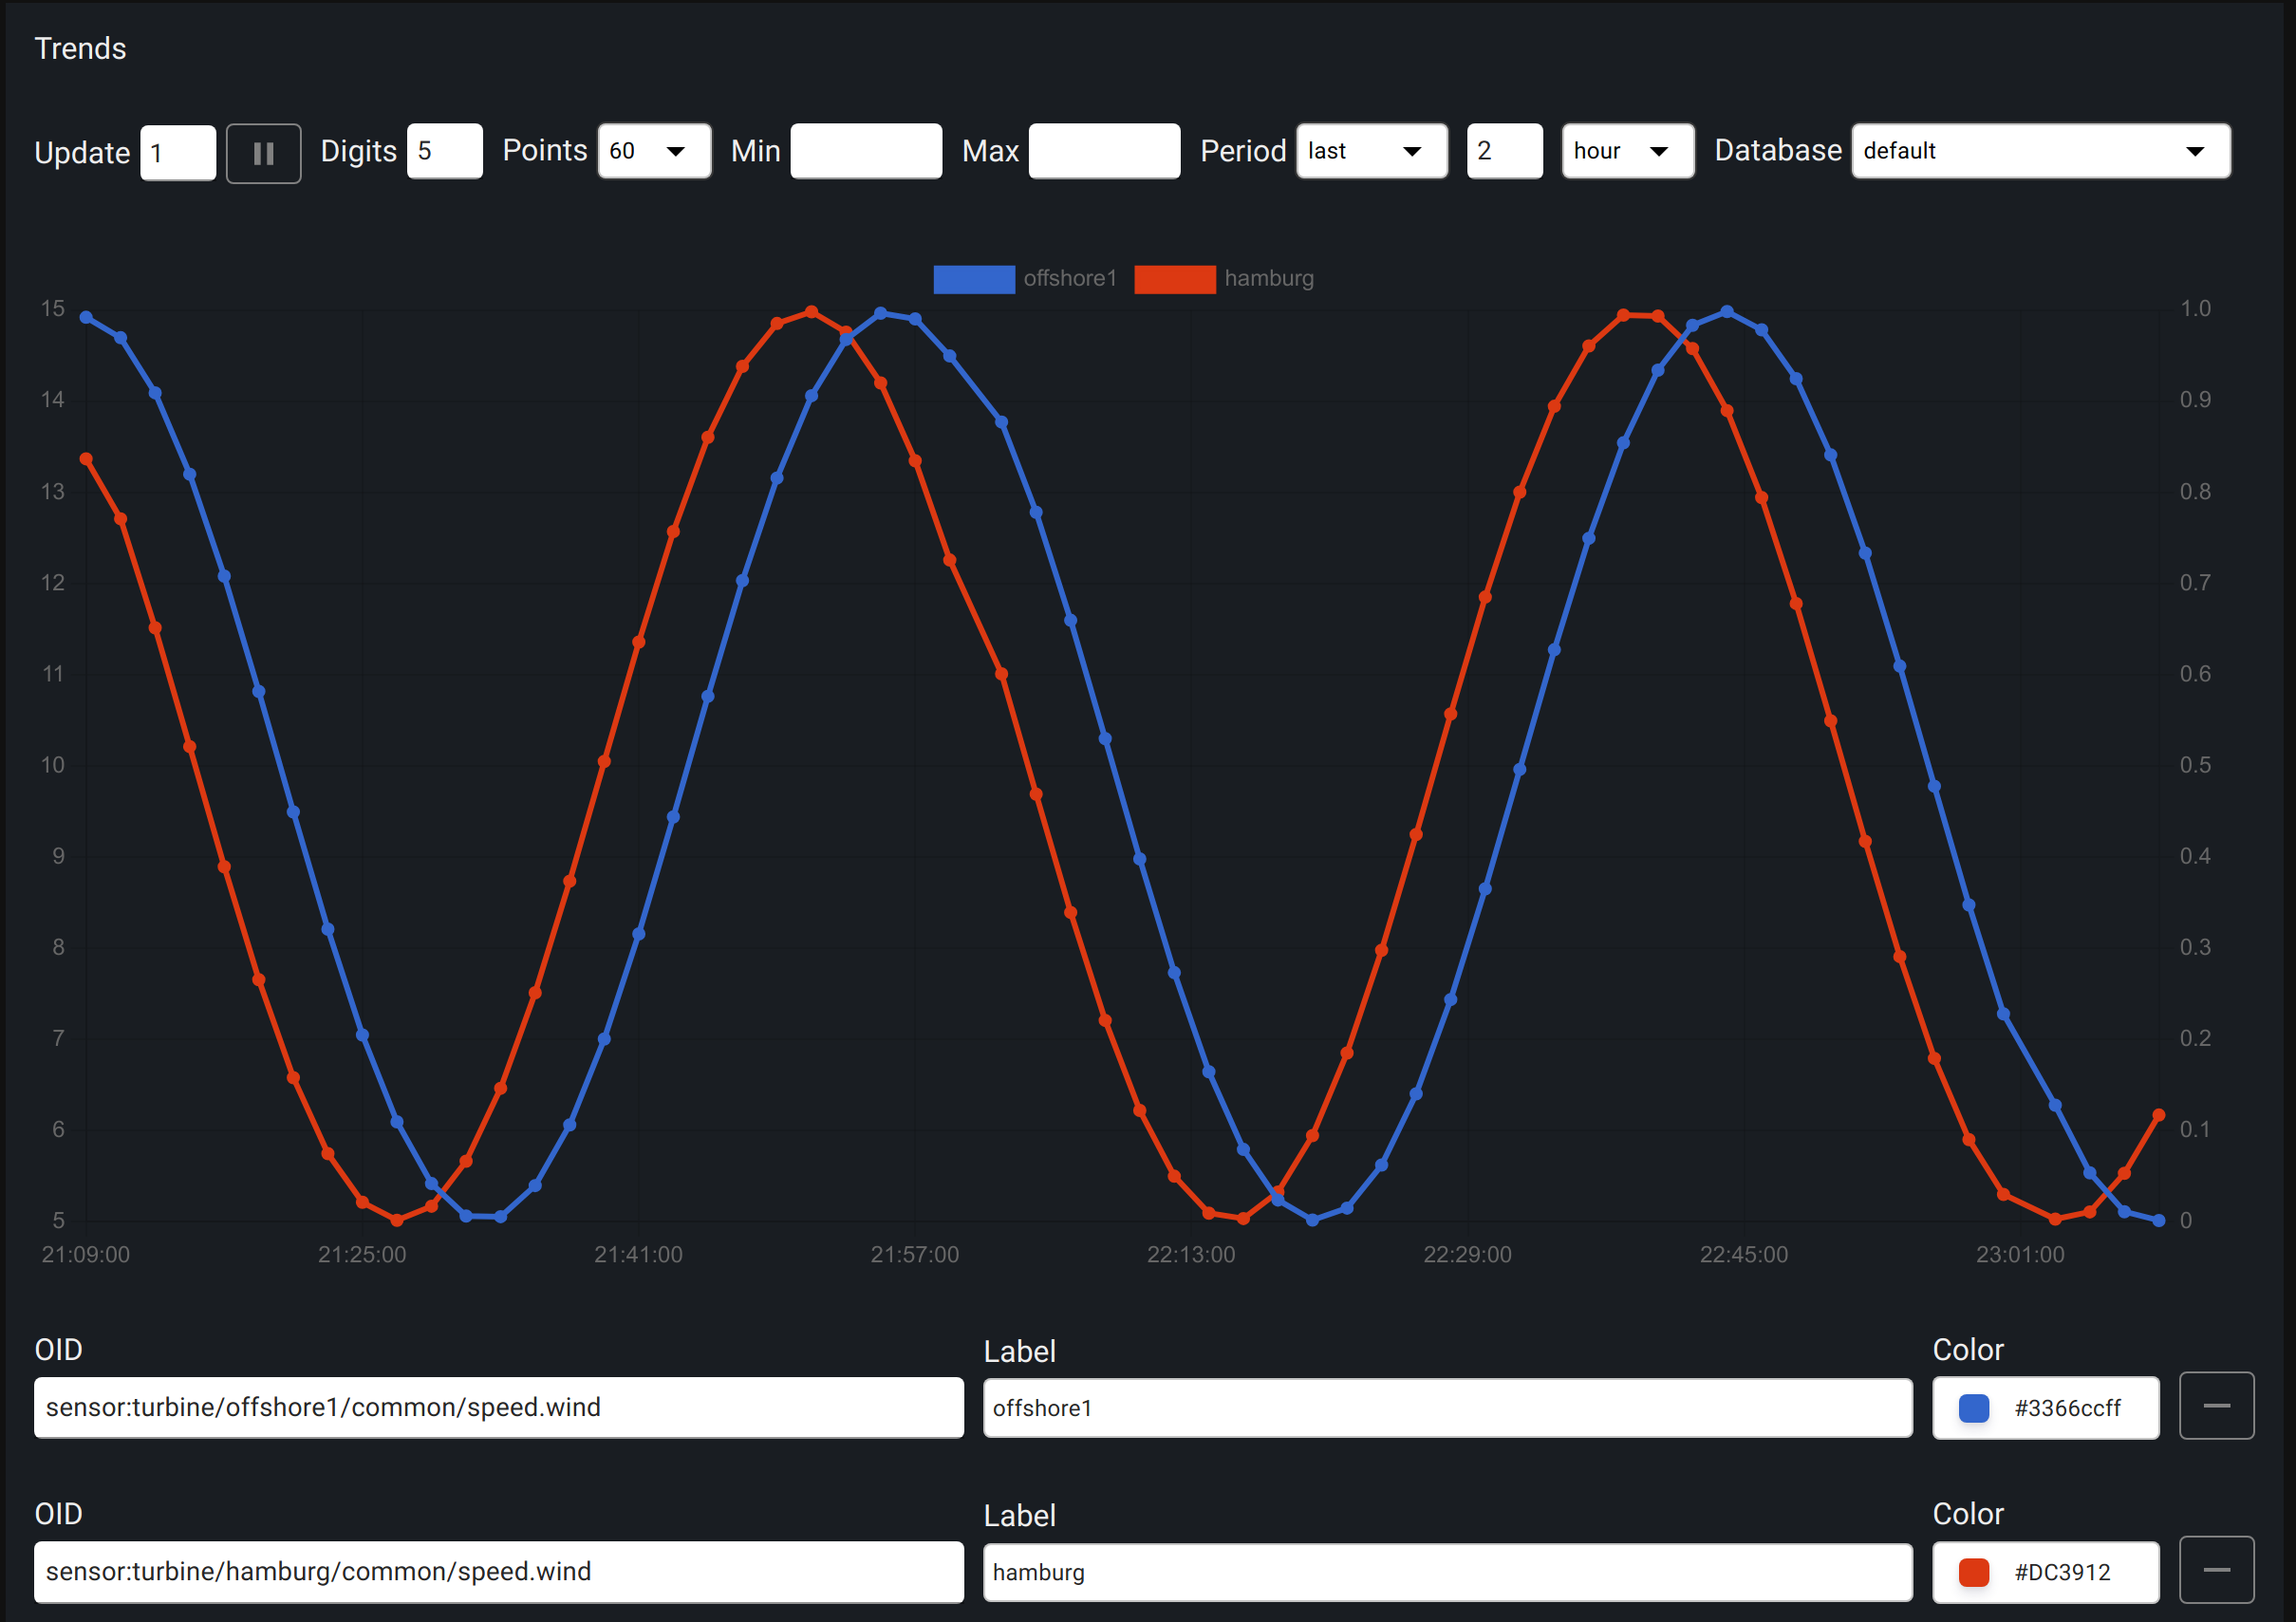
Use the upper panel to customize general chart settings.
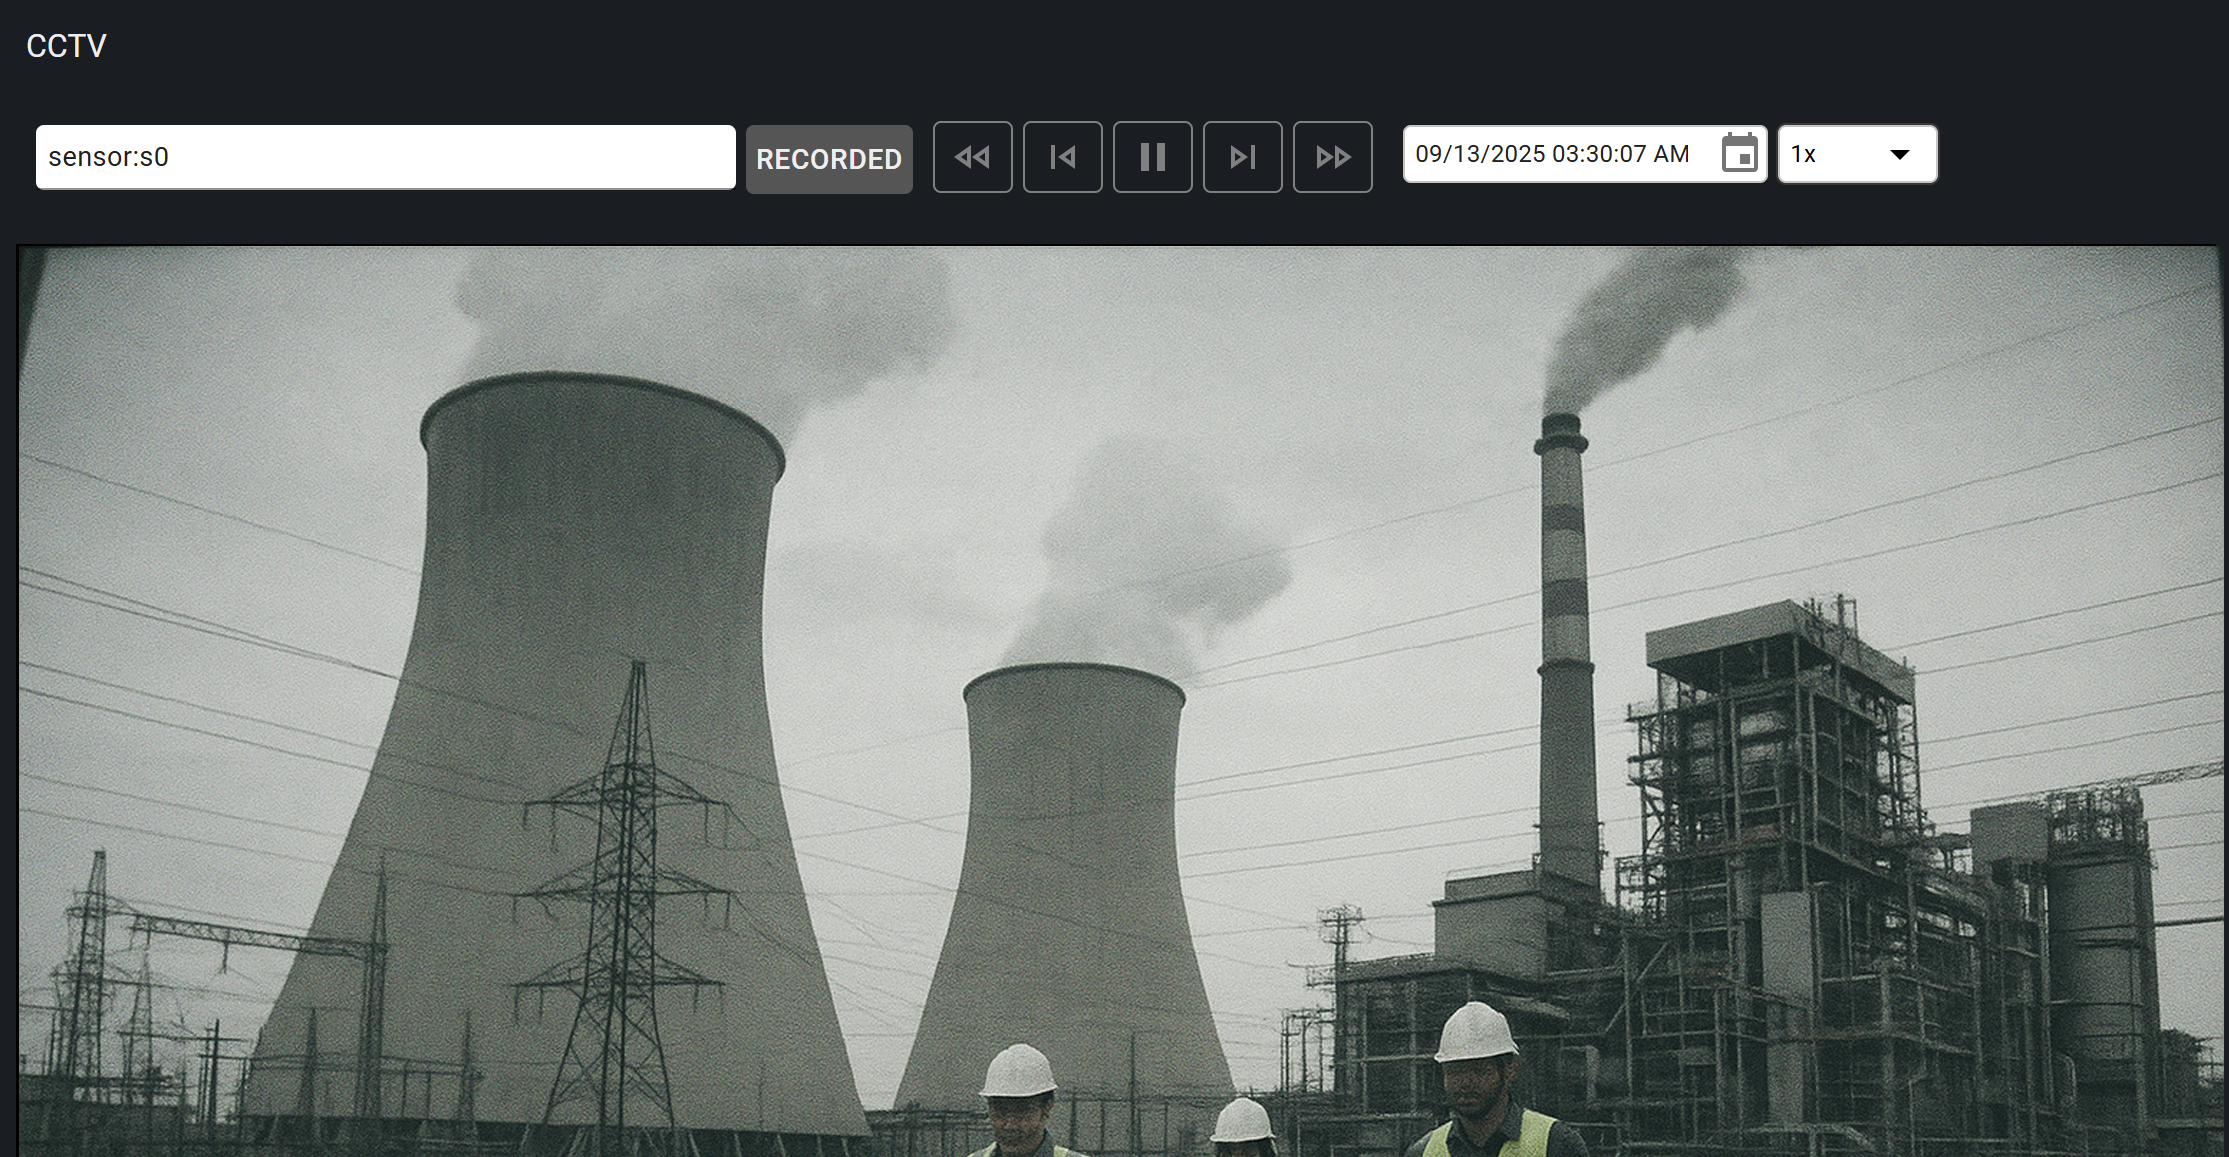
CCTV
The CCTV page allows to watch live video streams and video recordings created with Video server service.
By clicking Live/Recorded buttons, it is possible to switch between live and recorded version of a video stream sensor.
Note
The majority of the modern web browsers require secure connection to access video codecs, so make sure the application is opened via HTTPS
IDC
Interactive dashboard creator is a powerful editor/viewer for HMI interfaces.
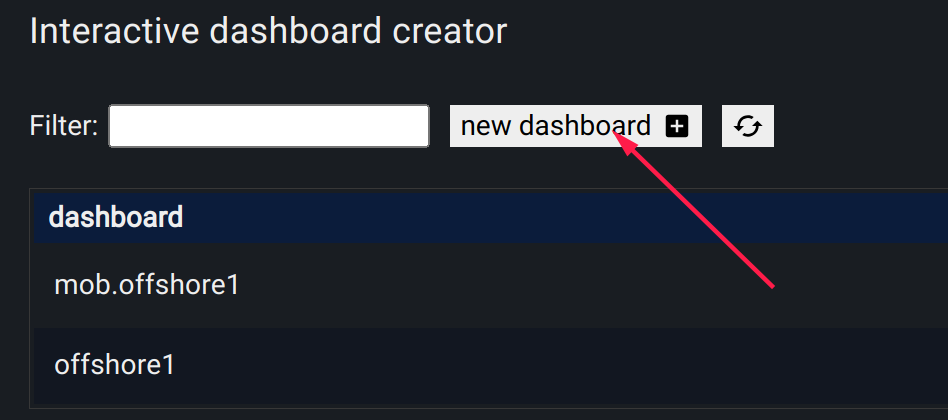
Creating a new dashboard
To create a new dashboard, press “new dashboard” button on the dashboard list top panel.
Note
Starting from EVA ICS v4 build 2024061801, dashboard subscriptions do not need to be manually managed.
Editing best practices
It is recommended to use IDC editor on desktops as it has got lots of useful keyboard shortcuts.
The full list of the shortcuts can be obtained by pressing “h” button.
The editor sidebar, as the most commonly used tool, is usually visible, unless closed by user.
To quickly open the side-bar, press “`” shortcut or double-click any dashboard element.
Dashboards are designed for particular devices are fixed (not responsive). For completely different devices (e.g. a large operator’s screen and a mobile phone) it is recommended to create several dedicating dashboards than trying to make a single versatile version.
IDC editor is used to quickly create simple dashboards / prototypes of interfaces. For production configuration, consider making a dedicated web-HMI application, using EVA ICS WebEngine and EVA ICS WebEngine React.
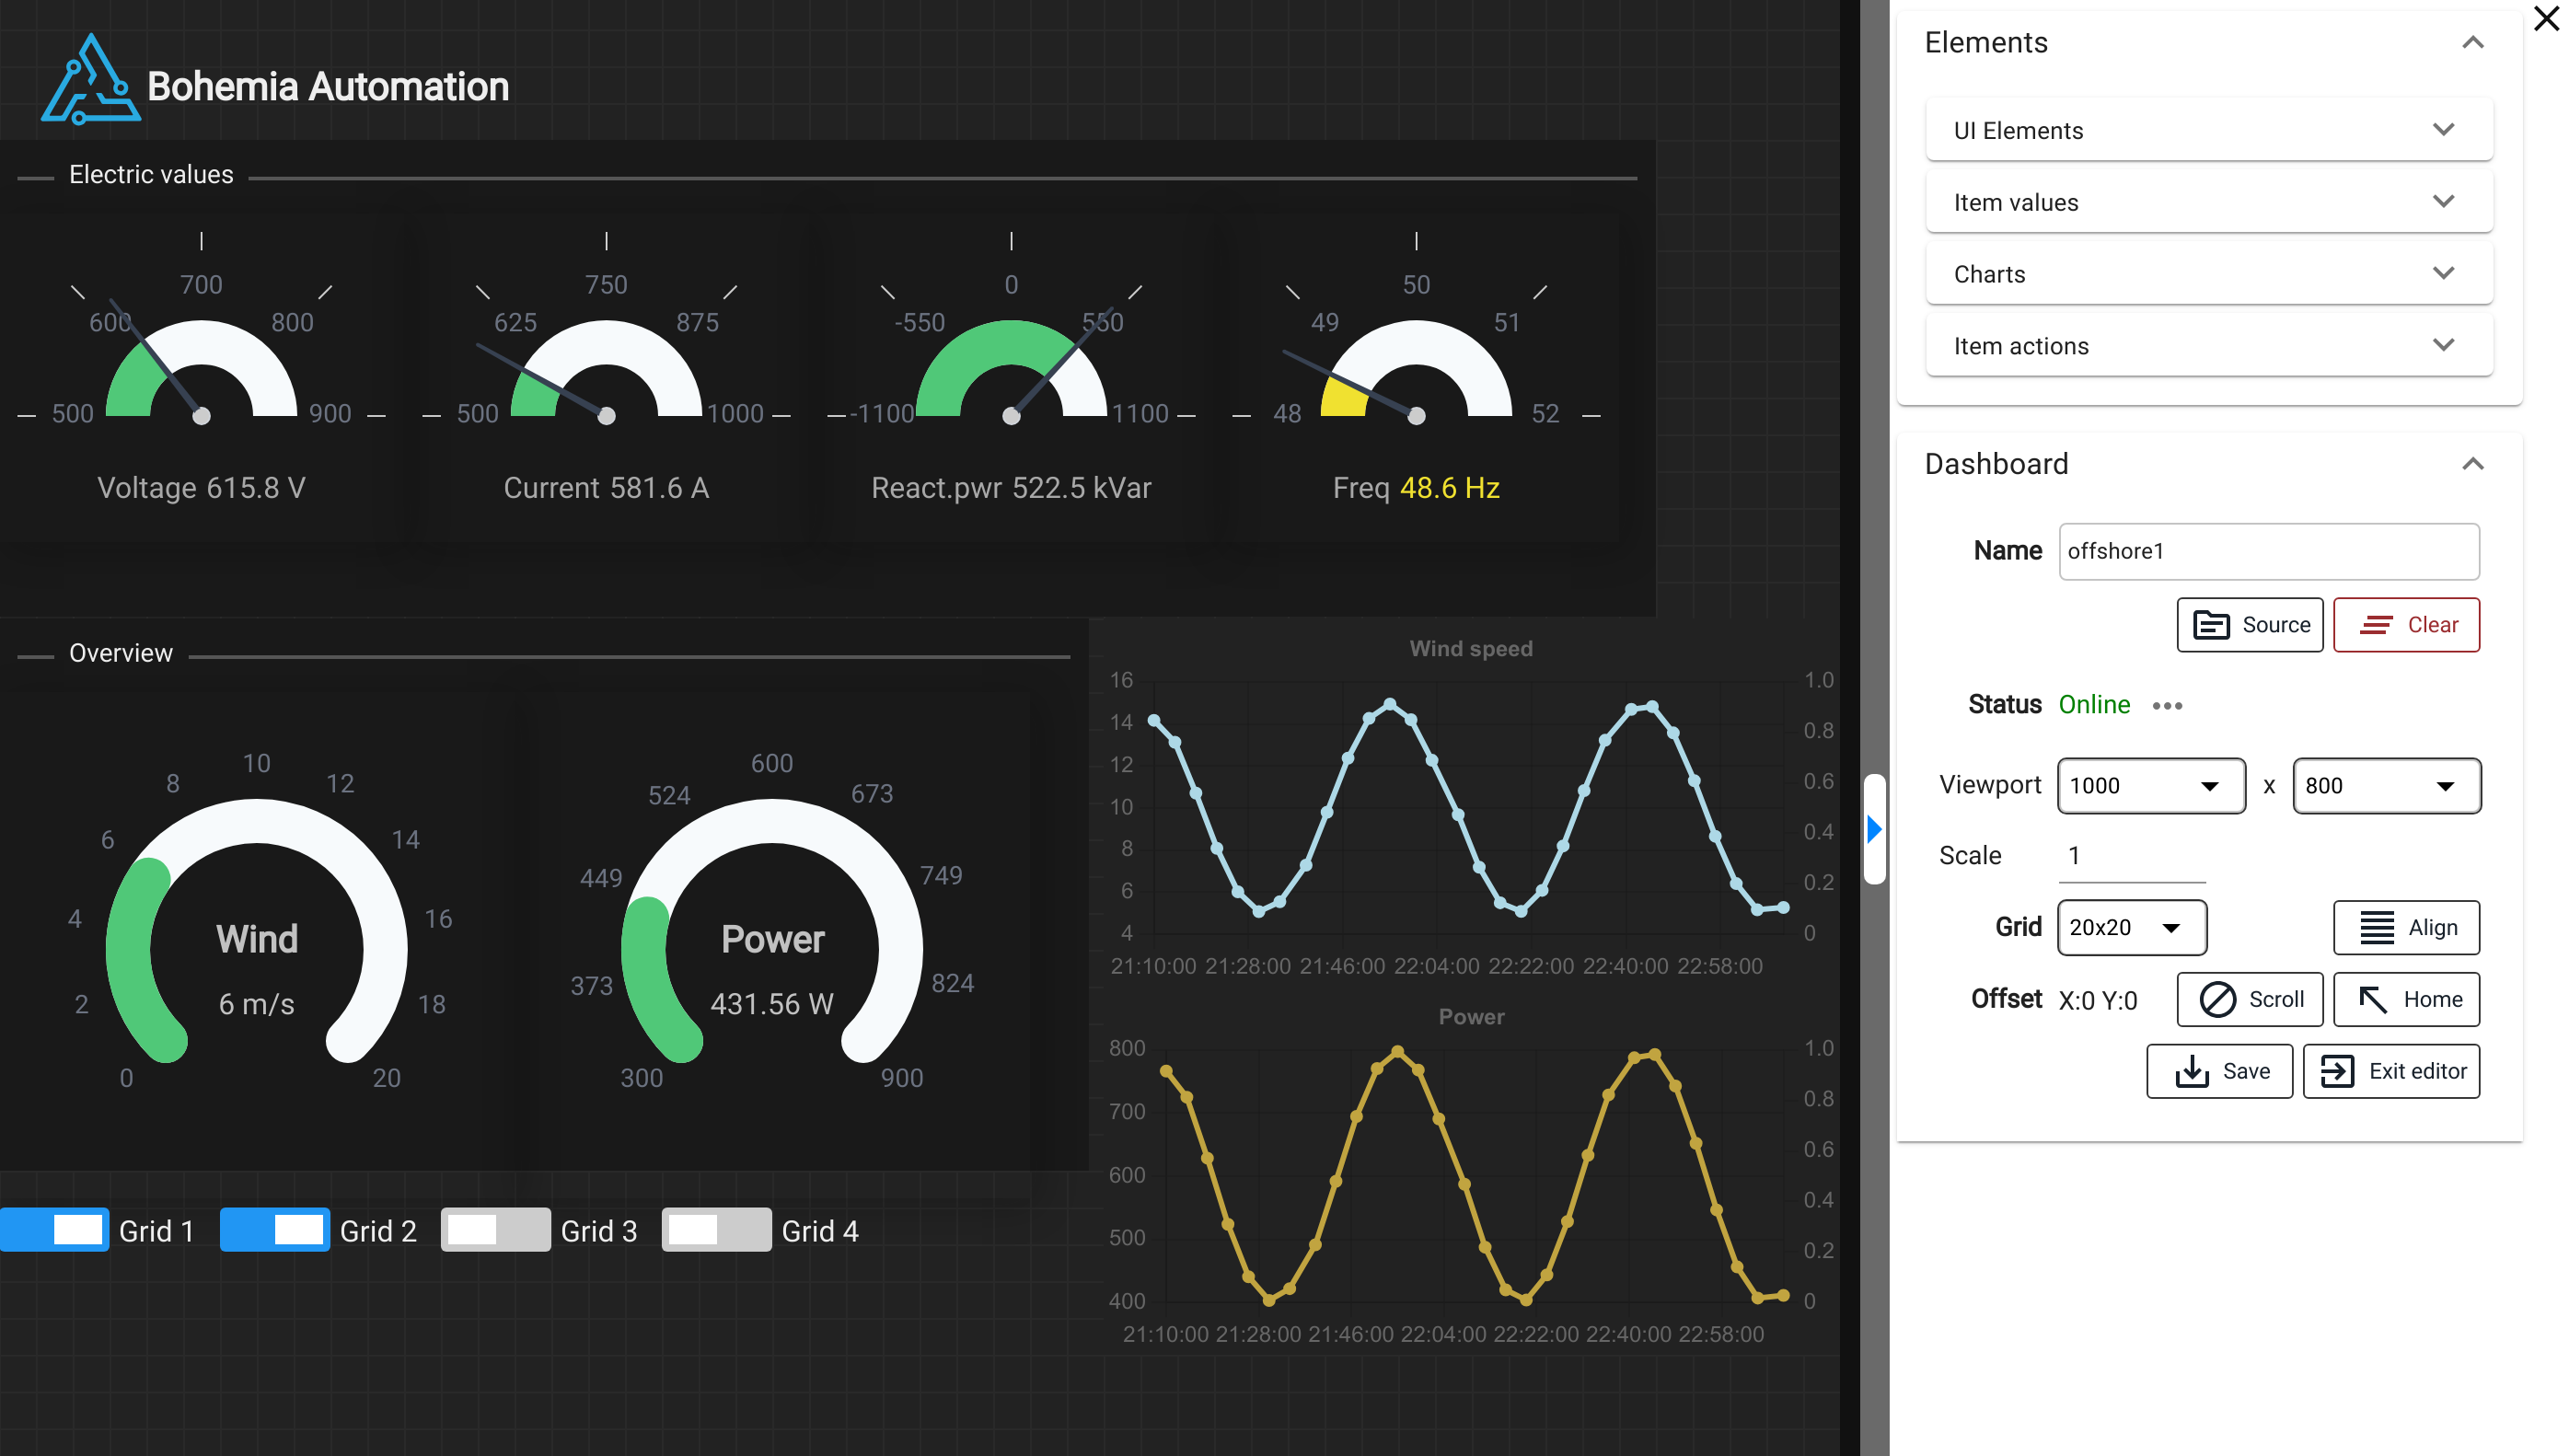
General dashboard parameters
The general dashboard parameters are always available on the side-bar.
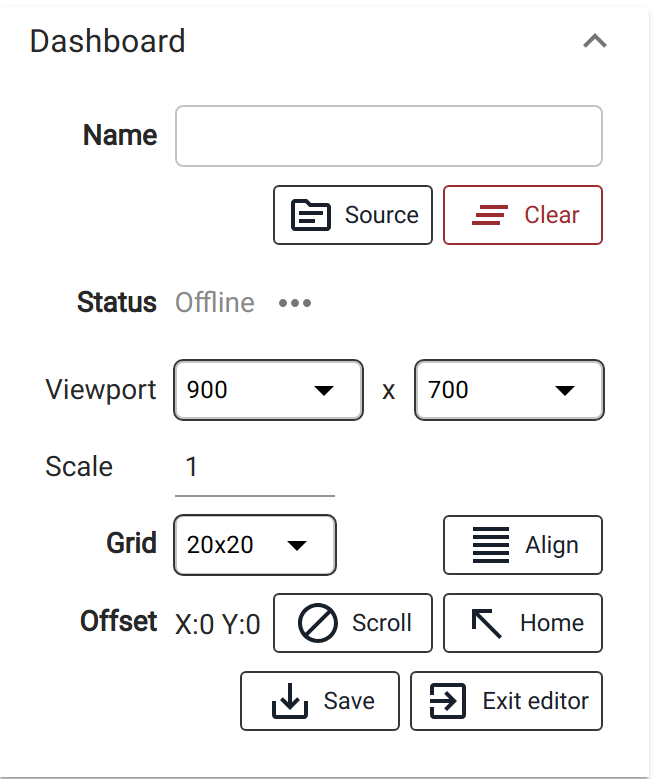
Name the name must be set before saving the dashboard. A dashboard can be also copied - set it the new name, then save.
Source the source button allows to view/edit/download/upload the dashboard source. It can be useful also for setting non-standard parameters e.g. non-standard viewport size.
Viewport IDC is designed to create dashboards for fixed viewports (non-scrollable), such as HMI touch panels, operators’ screens etc. Set the viewport size of the target device (can be set approximately). It is also possible to set viewport longer (wider) than the device screen, in this case it will be scrolled when viewed. Note that viewport is not always equal to the target device screen resolution in pixels, e.g. for Apple iPhone 12 Pro the screen resolution is 1170 x 2532, but the viewport is 390 x 844 pixels.
Scale is used for mobile devices (tables/phones). This allows to set larger viewport than the device has got, then scale the dashboard on it. The default scale is 1 (100%). Setting scale e.g. to 0.7 gives 70% scale as the result.
Grid a virtual parameter, used to auto-align elements when added/dragged.
Offset/Scroll/Home used to scroll a dashboard in the editor in case if the viewport is larger than the screen the dashboard is edited on. To enable scrolling, press “Scroll” button, then drag the dashboard by clicking on its empty space. The “Home” button is used to return the dashboard to the default position.
Save the button is used to save the dashboard on the node (the name must be already set).
Exit editor the button is used to exit the dashboard editor and return to the dashboard list.
Working with elements
Adding elements
To put a new element on the dashboard, open “Elements” section of the side-bar.
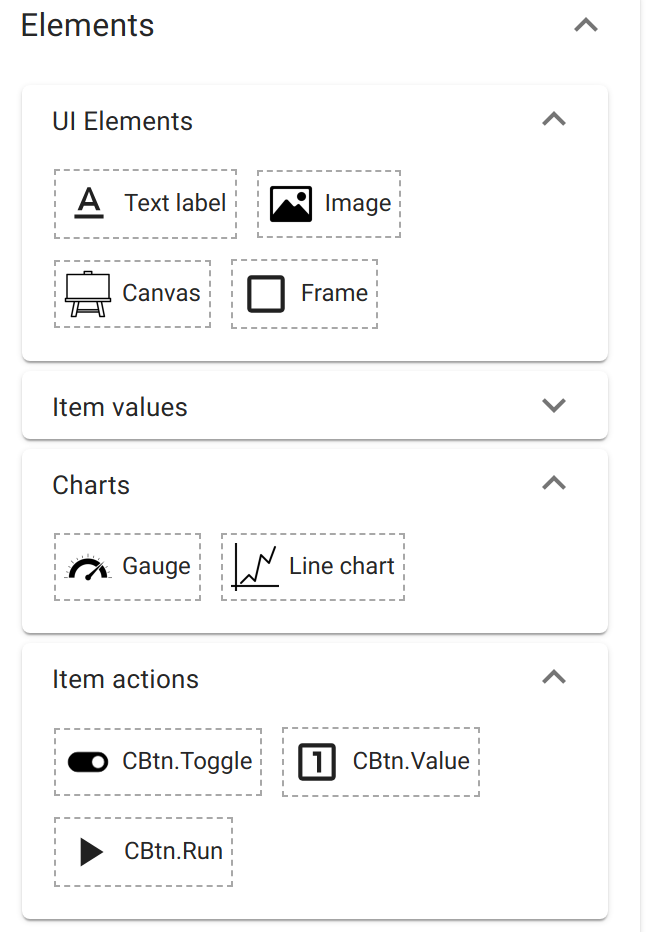
If using a mouse, drag (click and hold) an element and drop it to a desired position on the dashboard.
If using a touchscreen, tap on an element and it will be automatically added to the left-top corner of the dashboard.
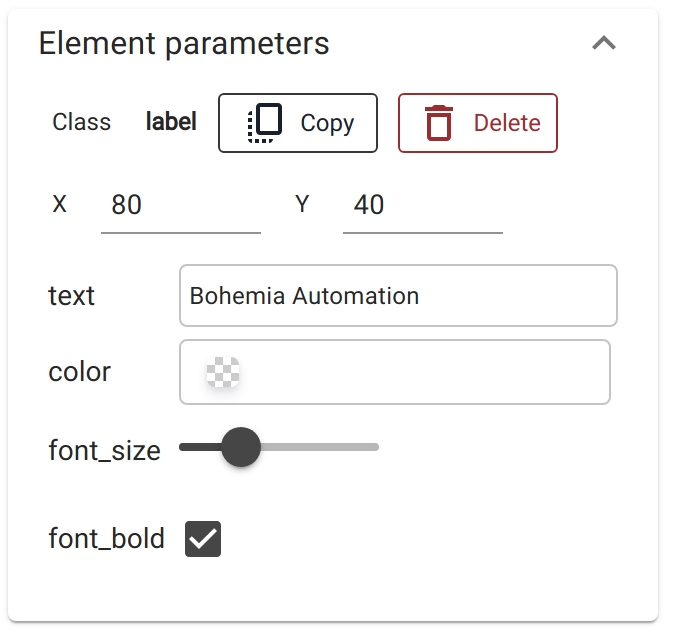
Editing elements
To select an element, click or tap on it. Newly added elements are selected by default.
The element can be moved (dragged) when selected. Parameters of a selected element are available on the side-bar.
Viewing dashboards
To view a dashboard, press “view” button in the dashboard list. The dashboard URL is always fixed and can be used for bookmarks/home page of HMI touch panels etc. If a user is not logged in yet, the login screen appears automatically.
After successful authentication the browser is automatically navigated to the desired dashboard.
Element properties
Certain elements have properties with additional formatting options.
Image
The SizedImage element has got additional image (URL) property formatting:
${token} when found in URL, is automatically replaced with the current EVA ICS API token
${ts} when found in URL, is automatically replaced with the current UNIX timestamp (in seconds)
IFrame
The IFrame element url property has got the same URL formatting as Image/image.
Custom cliparts
To use custom cliparts, create a folder pvt/vendored-apps/opcentre/idc/clipart/CLIPART_NAME on the server and put the clipart images there. As soon as the folder is created, the images are available for dashboards:
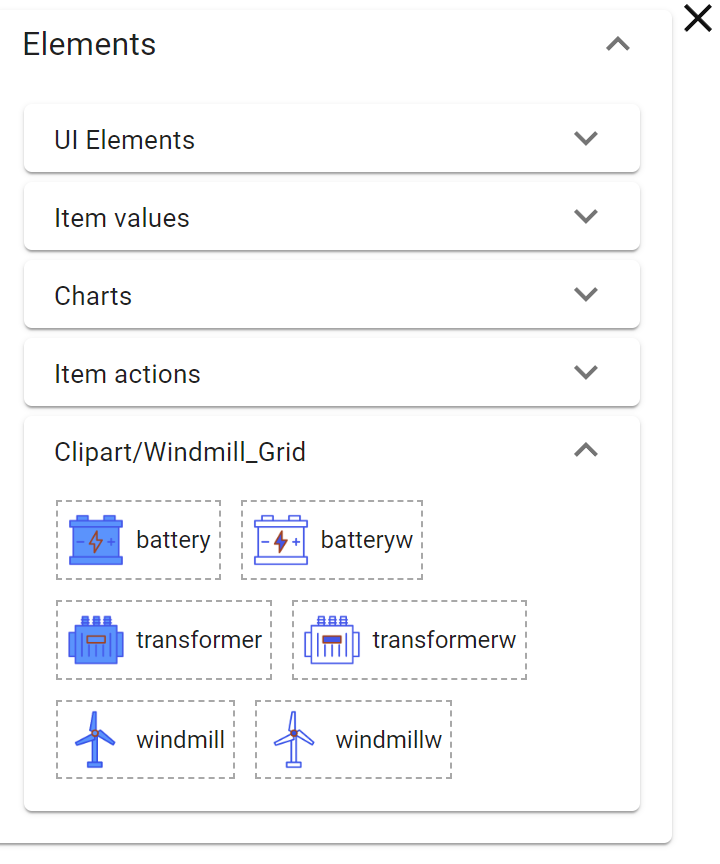
Each folder corresponds to a clipart category. The folders must contain image files only. Files with names starting with “_” symbol are reserved.
Dashboard variables
UI Elements/Dashboard variable component allows to define a switchable dashboard variable (string). As soon as a variable is defined, it can be used in all elements properties, as ${variable}.
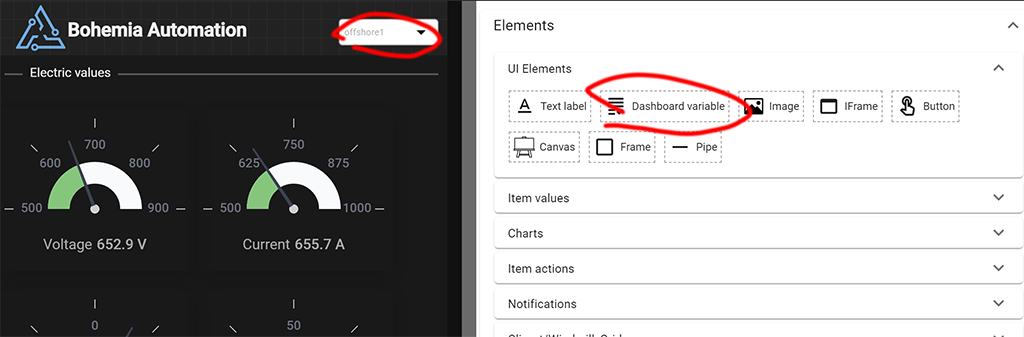
E.g. a variable named group switches item groups in item value components when their OID property is set as:
sensor:${group}/temperature
Custom elements
See Operation Centre custom IDC elements for custom elements development.