Reports
Contents
Report generation
EVA ICS Vendored UI applications provide built-in capabilities to generate various reports.
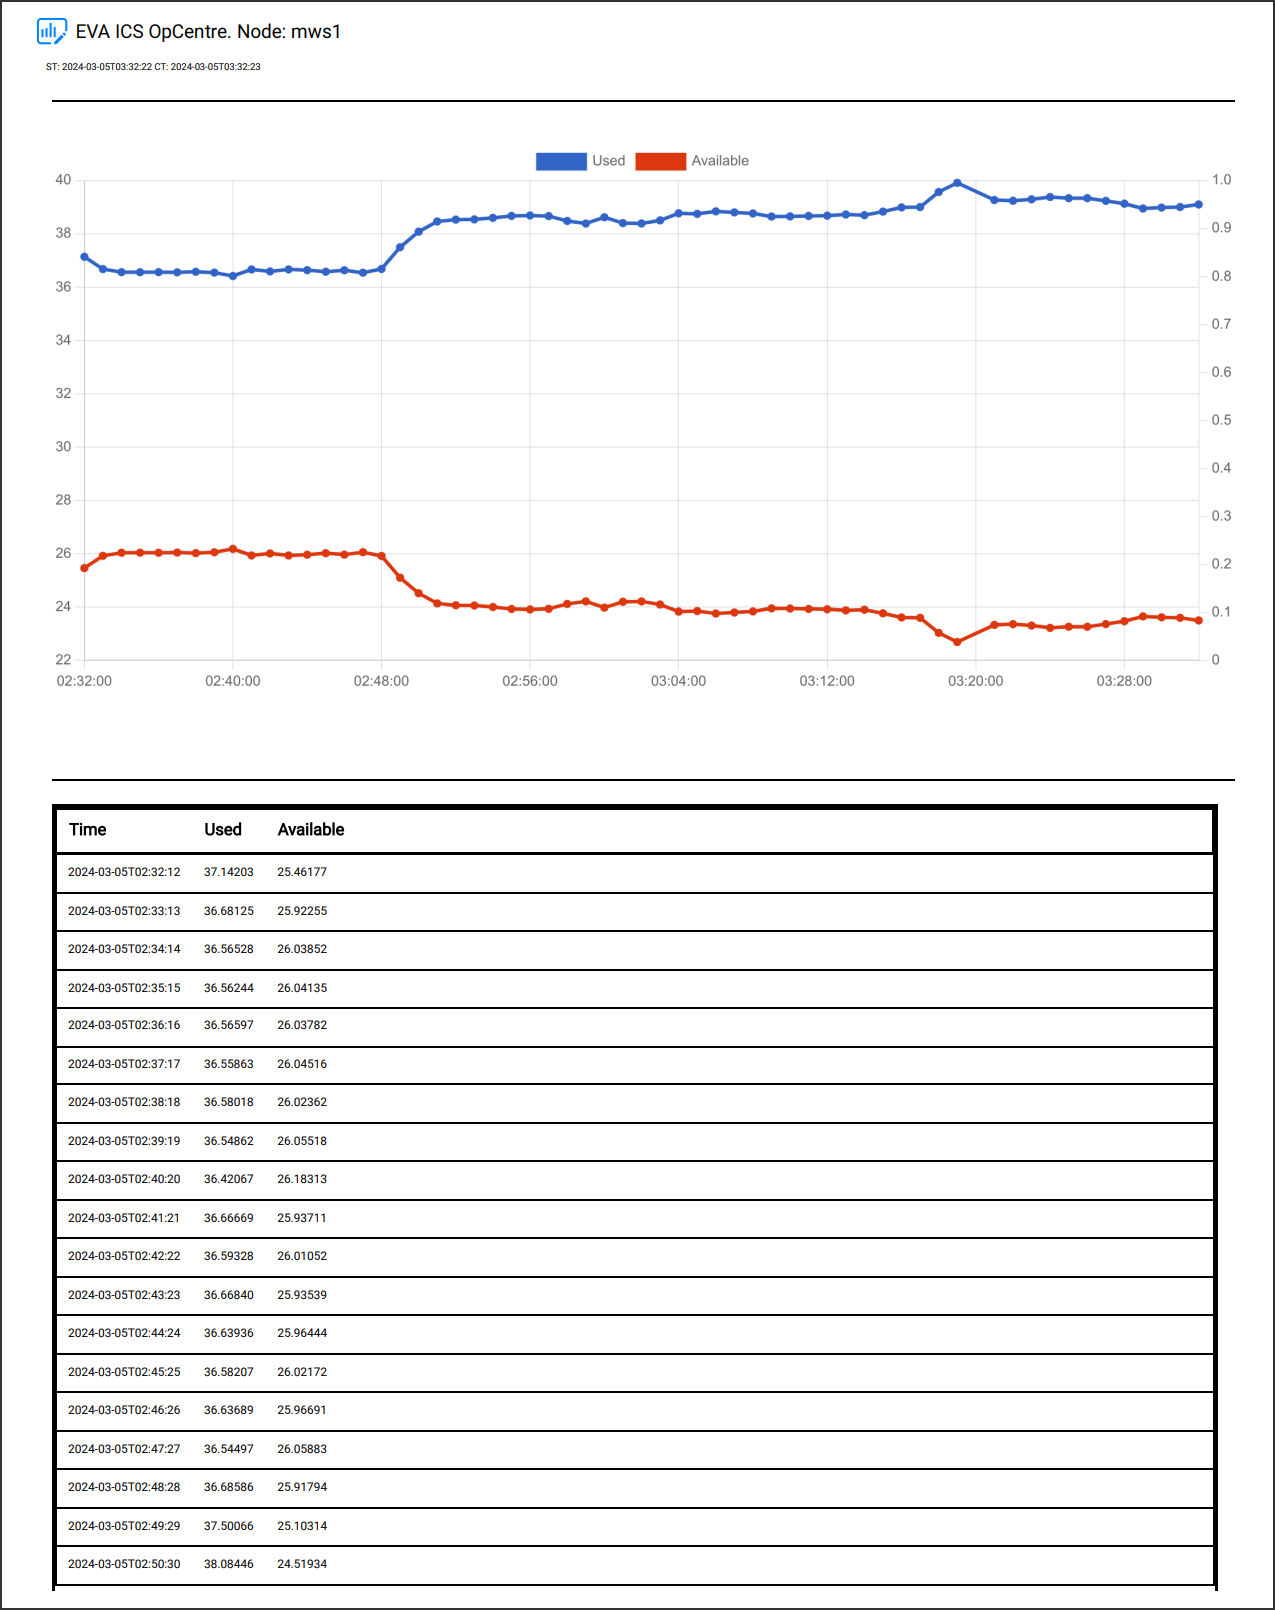
An example trends report, includes charts and a table with historical item data.
Unlike classic SCADA approach, when a dedicated reporting tool is provided, EVA ICS vendored UI applications allow users to use any page as a report source.
All application pages are optimized for printing and exporting as PDF. The applications automatically add required information, such as date/time (both server and client) of the report and hide sensitive data, such as user logins.
To generate a report, click on “Print” button on a page. Then select either a printer or a PDF file to write report into.

If a page does not provide a dedicated button to print itself, it can be still printed using Ctrl+P or by selecting File->Print operation in the menu of the web browser.
Report kinds
Reports provided by Node system dashboard:
System overview
Service status
Cloud status
Event accounting service (requires EVA ICS Enterprise)
System log
Reports provided by Operation centre:
Inventory items and their current states (including real-time chart snapshots)
Trends and their historical states (including real-time and historical charts)
Additionally, all dashboards created with IDC can be used as reports as well.
Data export
Certain pages also offer exporting data into a CSV file. To export data, click on “CSV export” button.

The exported data can be later used in spreadsheet programs (such as Microsoft Excel or LibreOffice Calc) to generate custom reports or perform additional calculations.