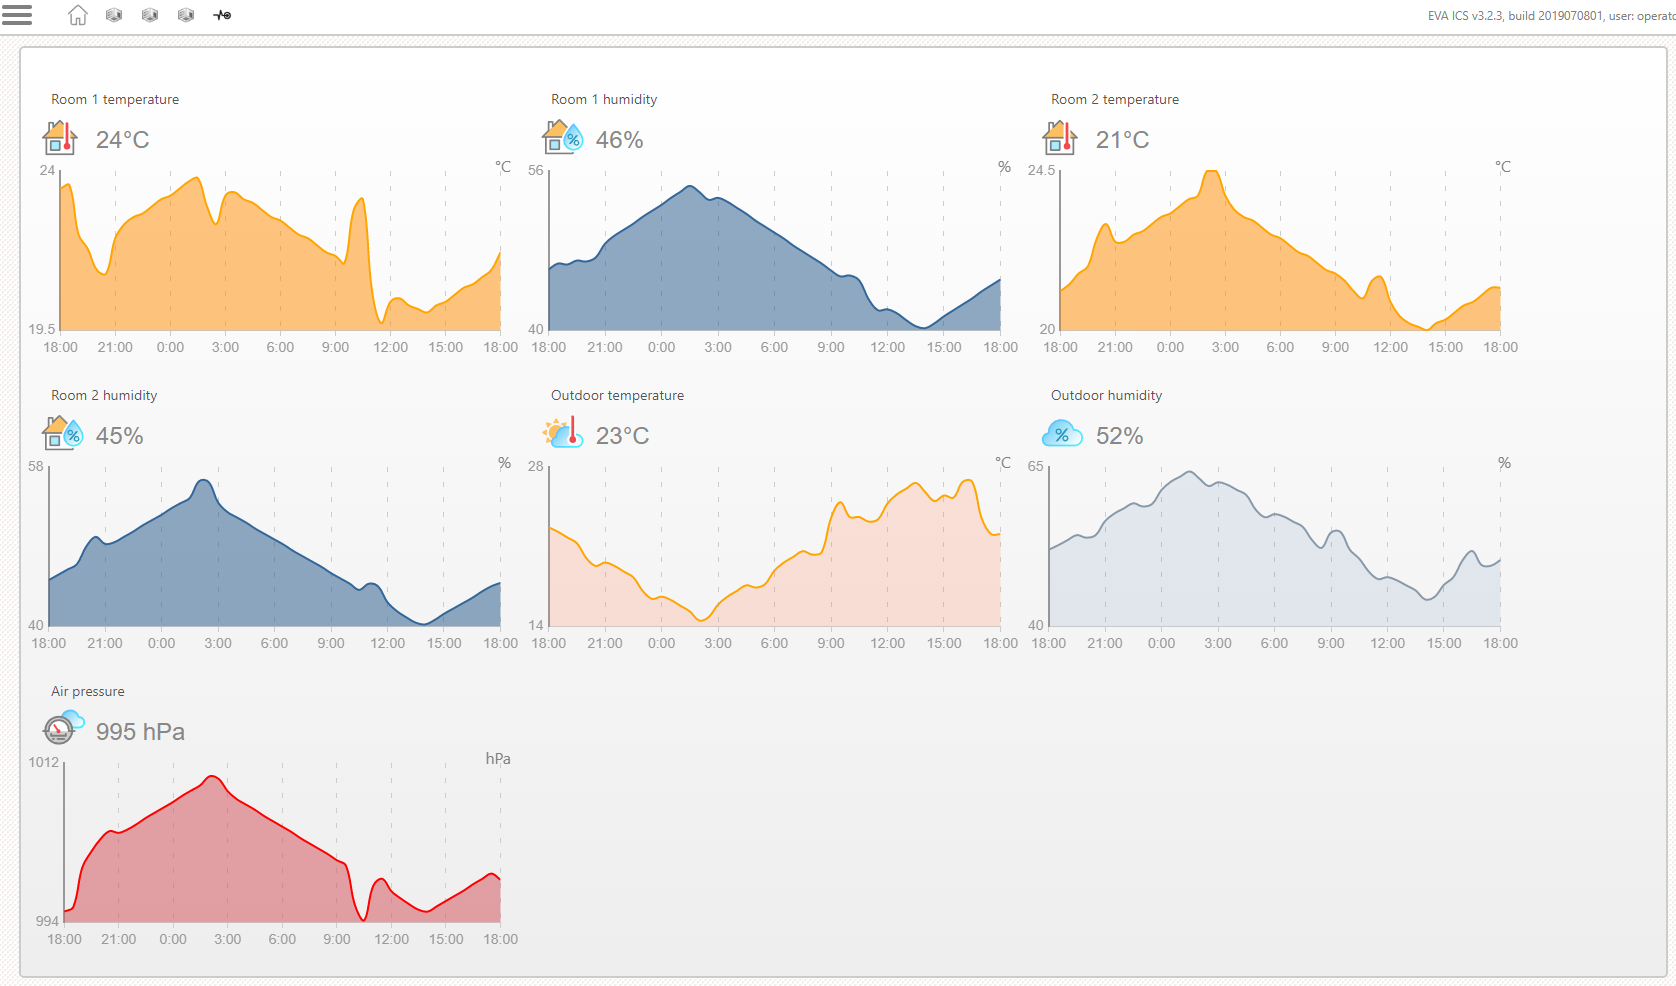
Sensors page
Sensor page class is used to display a charts.
Configuration looks like
#url: https://my.external.domain:port/
#main-page: /ui/
class: sensors
title: Charts - Sample Interface

charts:
  room1_temp:
    icon: indoor_temp
    item: sensor:env/temp1_int
    title: Room 1 temperature
    cfg: default
    units: "°C"
    color: orange
    fill: "false"
    #background-color: orange
    decimals: 0
    params:
      timeframe: 1D
      fill: 30T:1
      prop: value

  room1_hum:
    icon: indoor_hum
    item: sensor:env/hum1_int
    title: Room 1 humidity
    cfg: default
    units: "%"
    color: '#336699'
    fill: "false"
    decimals: 0
    #background-color: orange
    params:
      timeframe: 1D
      fill: 30T:1
      prop: value

  room2_temp:
    icon: indoor_temp
    item: sensor:env/temp2_int
    title: Room 2 temperature
    cfg: default
    units: "°C"
    color: orange
    fill: "false"
    #background-color: orange
    decimals: 0
    params:
      timeframe: 1D
      fill: 30T:1
      prop: value

  room2_hum:
    icon: indoor_hum
    item: sensor:env/hum1_int
    title: Room 2 humidity
    cfg: default
    units: "%"
    color: '#336699'
    fill: "false"
    decimals: 0
    #background-color: orange
    params:
      timeframe: 1D
      fill: 30T:1
      prop: value

  outdoor_temp:
    icon: outdoor_temp
    item: sensor:env/temp_ext
    title: Outdoor temperature
    cfg: default
    units: "°C"
    color: orange
    fill: "false"
    #background-color: orange
    decimals: 0
    params:
      timeframe: 1D
      fill: 30T:1
      prop: value

  outdoor_hum:
    icon: outdoor_hum
    item: sensor:env/hum_ext
    title: Outdoor humidity
    cfg: default
    units: "%"
    color: '#336699'
    fill: "false"
    decimals: 0
    #background-color: orange
    params:
      timeframe: 1D
      fill: 30T:1
      prop: value

  air_pressure:
    icon: pressure
    title: Air pressure
    item: sensor:env/air_pressure
    cfg: default
    units: " hPa"
    color: red
    fill: "false"
    #background-color: orange
    decimals: 0
    params:
      timeframe: 1D
      fill: 30T:1
      prop: value

layout:
  charts:
    - { id: room1_temp, reload: 180 }
    - { id: room1_hum, reload: 180 }
    - { id: room2_temp, reload: 180 }
    - { id: room2_hum, reload: 180 }
    - { id: outdoor_temp, reload: 180 }
    - { id: outdoor_hum, reload: 180 }
    - { id: air_pressure, reload: 180 }
  #sys-block: true
The page doesn’t have compact layout.
Global variables
main-page
As sensor class doesn’t have login window, main page uri may be specified. This variable may be used if navigation is not set up.
charts
Single-item chart
In section charts, chart configurations are specified. Single chart configuration looks like:
room1_temp:
  icon: indoor_temp
  item: sensor:env/temp1_int
  title: Room 1 temperature
  cfg: default
  units: "°C"
  color: orange
  fill: "false"
  #legend:
  background-color: orange
  point-radius: 0
  decimals: 0
  params:
    timeframe: 1D
    fill: 30T:1
    prop: value
icon chart item icon (CSS class .eva_hmi_data_item.i_<icon_name>)
item EVA ICS item to display a chart for, usually a sensor, but can be unit or logical variable as well
title chart title
cfg if specified and is not default, $eva.hmi.format_chart_config is called.
units value units. As YAML doesn’t like special characters, should be quoted
decimals value decimals after comma
params chart params for $eva.toolbox.chart function.
color chart line color (HTML color name or hex)
fill if true, chart will be filled
background-color chart background color (to fill)
point-radius chart point radius
Multiple-item chart
If you want to place multiple items on a chart, params item, color, fill, background-color and point-radius must be arrays.
If color and other options are not arrays, a single value is used for all chart items.
Example:
temp:
  icon: temp
  item:
      - sensor:env/temp_ext
      - sensor:env/temp1_int
  title: Temperature
  cfg: default
  units: "°C"
  color:
      - blue
      - orange
  fill:
      - "false"
      - "start"
  background-color: orange
  point-radius: 0
  decimals: 0
  params:
    timeframe: 1D
    fill: 30T:1
    prop: value
Note that upper chart items override lower, so e.g. if you have one item without fill and other with, place the first one before (as in example above)
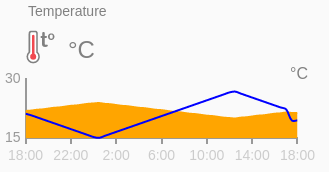
Chart with multiple timeframes
If you want to display data e.g. for today and yesterday on a single chart, specify timeframe param as an array. Other configuration options are the same as for multiple items chart:
temp:
  icon: temp
  item: sensor:env/temp_ext
  title: Temperature
  cfg: default
  units: "°C"
  color:
      - blue
      - orange
  fill:
      - "false"
      - "start"
  background-color: orange
  point-radius: 0
  decimals: 0
  params:
    timeframe:
      - 2D:1D
      - 1D
    fill: 30T:1
    prop: value
Note
Axis X is always formed from the first timeframe. If you want to change this, put “t” before the necessary timeframe, e.g.: t2D:1D
Multiple items and multiple timeframes
If multiple timeframes and multiple items are specified, chart data is filled as: first timeframe for all items, second timeframe for all items etc. So the above config would require 4 x colors (first two for 2 items and the first timeframe, and another 2 for 2 items and the second one), 4 x fills (or one same fill option for all, e.g. “false” to display 4 lines) etc.
Legend
If option legend is specified, chart legend is automatically generated. Example:
charts:
  room1_temp:
    icon: indoor_temp
    item: sensor:env/temp1_int
    title: Room 1 temperature
    cfg: default
    units: "°C"
    color:
      - orange
      - red
    fill: "false"
    background-color:
      - orange
      - red
    decimals: 0
    legend:
      - today
      - yesterday
    params:
      timeframe:
        - 2D:1D
        - 1D
      #timeframe: 1D
      fill: 30T:1
      prop: value
Note
If legend is present in eva_hmi_config_chart_options, legend auto generation is skipped.
layout
Layout section looks like
layout:
  charts:
    - { id: room1_temp, reload: 180 }
    - { id: room1_hum, reload: 180 }
    - { id: room2_temp, reload: 180 }
    - { id: room2_hum, reload: 180 }
    - { id: outdoor_temp, reload: 180 }
    - { id: outdoor_hum, reload: 180 }
    - { id: air_pressure, reload: 180 }
  #sys-block: true
Charts are listed in charts subsection, reload parameter specifies chart reload interval in seconds (default: 60 seconds).
If sys-block parameter is specified and is true, system block (system info, evaHI setup, logout link) will be displayed at the bottom of the page.
Chart options
For this page class, eva_hmi_config_chart_options must be defined which contains an options for Chart.js.
Usually, chart options are just a piece of JavaScript code, included in app as:
<script type="text/javascript" src="config/chart_options.js"></script>
and look like:
var eva_hmi_config_chart_options = {
  scales: {
    y: {
      ticks: {
        fontSize: 14,
        fontColor: '#999',
        userCallback: function(value, index, values) {
          if(index == 0 || index == values.length-1) return value;
        },
      },
      gridLines: {
        display: false,
        lineWidth: 2,
        tickMarkLength: 5,
        color: "#999",
      },
    },
    x: {
      type: 'time',
      time: {
        unit: 'hour',
        unitStepSize: 1,
        round: 'minute',
        tooltipFormat: 'HH:mm'
      },
      ticks: {
        fontSize: 12,
        fontColor: '#ccc',
        maxTicksLimit: 10,
        maxRotation: 0,
        autoSkip: true,
        callback: function(value, index, values) {
            if(index == values.length-1) {
              return '';
              } else {
              return this.getLabelForValue(value).split(' ');
              }
            },

      },
      gridLines: {
        display: false,
        lineWidth: 2,
        color: "#999",
        drawOnChartArea: false,
        tickMarkLength: 10,
        borderDash: [5, 10],
      },
    },
  },
  plugins: {
    filler: {
      propagate: true
    },
    legend: { display: false }
  },
  elements: {
    line: {
      //tension: 0, // disables bezier curves
      borderWidth: 2,
    }
  },
  tooltips: {
    mode: 'index',
    intersect: false,
  },
  animation: {
    duration: 1000, // general animation time
  },
};
Chart options can be either variable or function (preferred).
Note
HMI block UI is based on EVA ICS JS Framework which includes ChartJS version 4.